How Salaries Are Determined: What Sets Pay in the US
Salaries come from job content, market data, pay ranges and the individual. See how US employers set pay, and how to read the wage data behind it.
By the Salary Atlas editorial team · Published

Most US employers set a salary in two steps. First they price the job against what similar positions pay in the same region and industry. Then they decide where one person lands inside that job's pay range, based on skills, experience and performance. Budget, local labor supply and legal minimums shape both steps.
This guide walks through that process from the employer's side, then shows what it means if you are the one being paid, or the one setting pay.
TL;DR
- Employers usually pay according to what similar positions earn in the same region and industry, then place each person within a range.
- The job sets the range. The person sets the spot in it: education, experience, certifications and performance.
- Location, industry, labor supply and the company's finances move the numbers up or down.
- Federal law sets a floor of $7.25 per hour for covered non-exempt workers. Many states set a higher one.
- Government wage data, published by percentile, is the most neutral yardstick for checking whether a number is typical.
Table of Contents
- The two questions behind every salary
- Step 1: Defining what the job is
- Step 2: Pricing the job against the market
- Step 3: Building a salary range
- Step 4: Placing the person inside the range
- How institutions classify jobs and band pay
- What else shapes a paycheck
- Salary, hourly wage, base pay and total compensation
- Using public wage data to check a number
- Putting it to work
- Where Salary Atlas fits
- Perspective
- FAQ
- Sources
The two questions behind every salary
Every salary answers two separate questions. The first is what the job is worth. The second is what this person should be paid to do it.
Lehigh University's HR department describes the split clearly. Paying for the job means defining the relevant market, matching the job to it, and assigning the job to a grade in the salary structure. Paying the individual means weighing that person's skills, knowledge, experience and performance to find the right position within the grade's range.
The University of Rochester's pay guidelines say the same thing in their own words. Job content and role set the range. The responsibilities and scope of the role, together with the holder's skills, education, experience and performance, set the individual's base pay inside it.
That is why two people with the same title can earn different amounts, and why two jobs that look similar can sit in different ranges.

Step 1: Defining what the job is
Before anyone looks at a market survey, the employer has to know what the job actually involves. The U.S. Chamber of Commerce advises businesses to run a thorough job analysis before setting ranges, so compensation lines up with responsibilities, required qualifications and market value.
The Chamber lists the factors that feed into pay: job responsibilities, required skills and certifications, experience, education, market demand and geographic location.
The University of Rochester guidelines add detail on how jobs get placed in a range. The criteria include:
- the scope and major responsibilities of the role
- the complexity and impact of the work
- the knowledge, skills and competencies needed
- the minimum education and experience required
Step 2: Pricing the job against the market
Once the job is defined, the employer asks what the market pays for it. This is called market pricing, and it is the dominant method. A 2009 WorldatWork survey found market pricing was the most prevalent job evaluation method across job types, used by 67 to 75 percent of organizations. Between 80 and 90 percent of respondents used at least two survey sources to price jobs, and most aimed to pay between the 40th and 60th percentile for base salary.
That last point matters. Most employers do not try to pay the highest rate in the market. They aim for the middle, and move above it for hard-to-fill roles or critical talent.
What counts as the "market"
The market is not the same for every job. The same WorldatWork survey found that the higher the position, the broader the labor market. About 82 percent of organizations used national survey data to price senior management roles, but only 33 percent used national data for production jobs. Production and entry-level jobs are priced against local or industry-specific data.
So a warehouse supervisor's pay tracks the local labor market, while a chief financial officer's pay tracks a national one.
External factors that move the market rate
The IEEE Computer Society names four external factors organizations weigh when setting salaries:
- The availability of qualified workers
- Standard market rates for the position
- Regional costs of living
- The skills and education the job requires
Step 3: Building a salary range
Employers rarely pay a single number for a job. They build a range with a minimum, a midpoint and a maximum. The DOL notes that many positions have an employer-set range with a minimum and maximum pay rate, sometimes with a midpoint used to guide raises.
The midpoint usually reflects the market rate. The width of the range is called the spread. According to CompLogix, the minimum equals the midpoint divided by (1 + spread/2), and the maximum equals the midpoint times (1 + spread/2).
Here is the worked example from that source: a job with an $80,000 midpoint and a 50% spread has a minimum of $64,000 and a maximum of $100,000.

Two common methods build these structures. According to SHRM, the two most common are market pricing, which uses external data, and the point-factor method, which focuses on internal pay equity. Only 3 percent of companies relied solely on point-factor, while 19 percent blended both approaches. That survey dates from 2010, so treat the percentages as a snapshot of the era, not today's split.
The same SHRM piece, citing Culpepper and Associates, notes that a well-designed structure lets management reward performance and skill growth while controlling base salary costs, because the range puts a cap on what a job can pay.
Step 4: Placing the person inside the range
This is where individual qualities enter. The University of Wisconsin-Madison's HR job aid lists the compensable factors: job-relevant knowledge, skills, abilities, experience, education, licenses and certifications. Entry-level candidates should start near the beginning of the range, and experienced candidates further along. Managers can use quartiles to think about placement.
A simple way to picture it:
| Where the person falls | Typical profile |
|---|---|
| Bottom quartile | Meets the minimum requirements, new to the field or the role |
| Second quartile | Fully qualified, still growing into the job |
| Third quartile | Strong experience, consistently strong performance |
| Top quartile | Deep expertise, often beyond what the job strictly requires |
Compa-ratio: how employers check placement
HR teams use a measure called compa-ratio to see where people sit relative to the midpoint. The Employers Council explains it as actual pay divided by the range midpoint. A ratio of 1.0 means the person is paid at midpoint. A low average compa-ratio across a company can signal that pay is not keeping up with the market.
CompLogix expresses the same idea as a number out of 100, and describes 90 to 110 as the comfortable zone for a fully performing employee. Using the earlier example, someone earning $80,000 on a range with an $80,000 midpoint has a compa-ratio of 100.
How institutions classify jobs and band pay
Large employers such as universities, hospitals and governments formalize all of this into grades and bands. Each job is classified, matched to a grade, and each grade carries a range. If you want to see how that looks in practice for one profession, this HR generalist pay example shows how a single role's pay is read and negotiated.
Nonprofits and schools add a further constraint: they balance internal fairness, market competitiveness and limited budgets, and top-level pay is subject to governance rules. Boards setting leadership pay can review nonprofit executive compensation rules as part of that process.
What else shapes a paycheck
OpenStax, in its business textbook, says wages, salaries and benefits rest on skills, experience and job level. It adds company-side factors: competitors' pay, the firm's financial condition or profitability, efficiency and employee productivity.
In practice that means:
- Company finances. A profitable firm can pay at the top of the market. A firm under pressure may hold ranges flat.
- Competitors. If rivals raise pay for a role, retaining staff means matching them.
- Productivity. Roles that directly drive revenue are often valued more highly.
- Performance. After hire, merit increases move people through the range.
The legal floor
The federal minimum wage for covered non-exempt employees is $7.25 per hour, according to the DOL's Veterans' Employment and Training Service guide from January 2022. States have their own laws that can be set higher or lower, but the amount an employee actually receives can never fall below the federal requirement. Check your state labor department for the current rate where you work, because many states have raised theirs.
Salary, hourly wage, base pay and total compensation
These terms get mixed up, and the difference affects how you read any pay figure.
- Salary is a fixed amount paid per year, usually split across pay periods regardless of exact hours.
- Hourly wage is a rate multiplied by hours worked, so earnings change with the schedule.
- Base pay is the guaranteed core rate, before bonuses, commissions or overtime.
- Total compensation adds everything else: bonuses, incentives, benefits and other perks.
Using public wage data to check a number
Employers do buy private surveys, but you can check a typical wage yourself with government data. The Occupational Employment and Wage Statistics program is a comprehensive source of occupational employment and wage information for the nation, states, territories and metropolitan and nonmetropolitan areas. It reports wages at the 10th, 25th, 50th, 75th and 90th percentiles for about 830 occupations.
CareerOneStop's Salary Finder, with data last updated in June 2025 and reflecting May 2024 estimates, explains how to read the percentiles. The high figure is the wage that 90 percent of workers earn less than, the median is the wage that half earn less than, and the low figure is the wage that 10 percent earn less than. Yearly figures apply only to full-time, year-round workers.
How to read the percentiles
- 10th percentile: roughly where entry-level or lowest-paid workers in the occupation sit.
- 50th percentile (median): the middle of the market, the usual target for a fully qualified worker.
- 90th percentile: senior, specialized or high-cost-area workers.
Putting it to work
If you are setting pay
- Write a clear job description and analyze the duties, skills and qualifications.
- Pull wage data for the occupation in your region and industry, from more than one source.
- Choose where you want to compete, for example the median.
- Build a range around that midpoint with a spread that fits the job's growth path.
- Place each hire by experience and skills, and document why.
- Check compa-ratios periodically to see whether pay is drifting from the market.
If you are being paid
- Identify the occupation and the percentile data for your state.
- List the factors that justify a higher placement: certifications, years of experience, scope of responsibility.
- Ask what the range is for the role and where your offer falls inside it.
- Compare like with like, base pay to base pay.
Where Salary Atlas fits
When you want a figure to anchor a pay decision, you need to know where it came from. Salary Atlas presents US salary and wage data from the Bureau of Labor Statistics by job title, percentile, state and experience level, in hourly and annual terms, and links every figure back to its source. There is no paywall and no signup, and we do not estimate or fabricate wages.
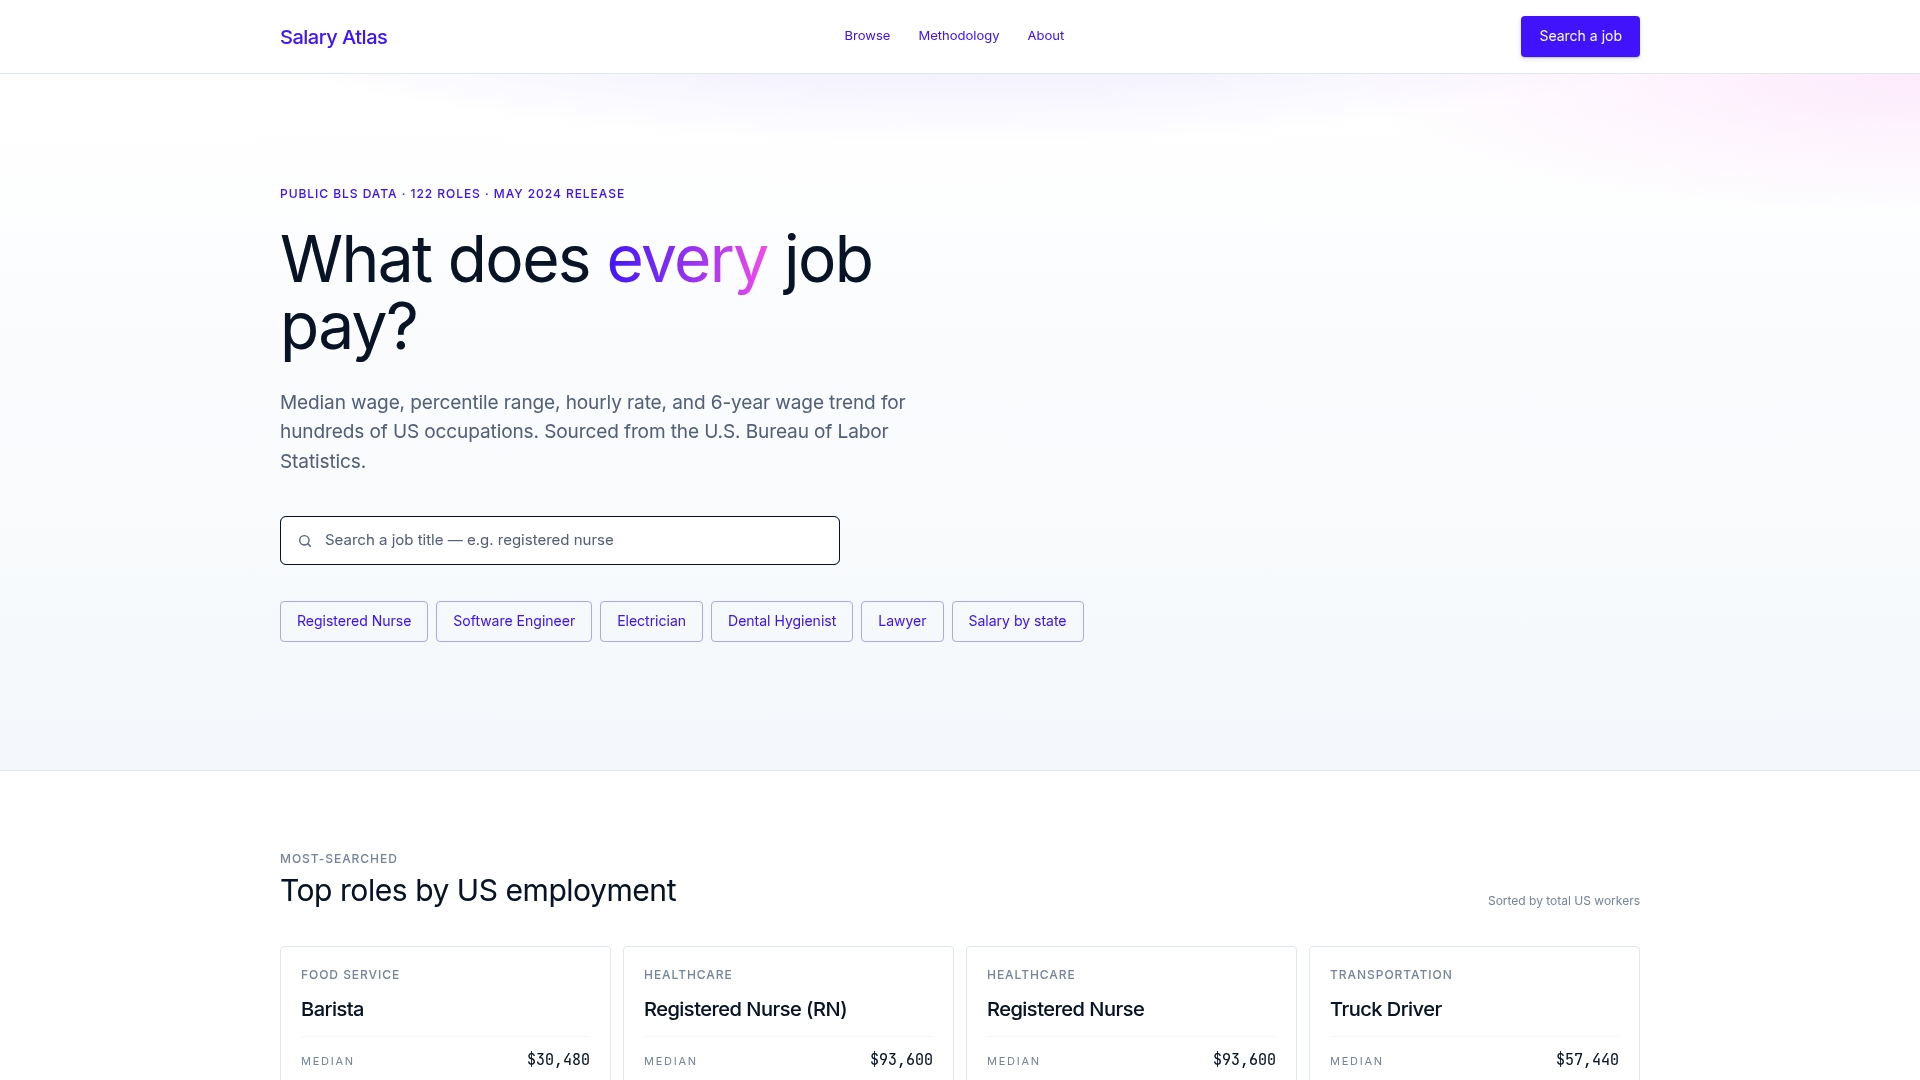
Look up your occupation on Salary Atlas to see the percentile spread for your state before your next offer, review or pay-range exercise.
Perspective
Pay looks mysterious because the numbers people quote are rarely traceable. A salary range exists for reasons: a job analysis, a market definition, a midpoint, a spread. Most of those inputs are public if you know where to look.
We built Salary Atlas around one conviction: wage information should be free to read and checkable to the source. We take our figures from the Bureau of Labor Statistics, we show them by percentile so you see a spread rather than one flattering average, and we refresh them annually. We do not blend in self-reported or scraped numbers, and we do not invent trends to fill a gap.
For job seekers, that means walking into a negotiation with a defensible number. For employers and HR teams, it means starting a range from a transparent midpoint rather than a guess. Good pay decisions begin with honest data.
Joelen Zyoktova
FAQ
How do employers determine salary?
Employers usually price the job against what similar positions pay in the same region and industry, then assign it a pay range. Within that range, the individual's skills, experience, education and performance set the exact figure. Budget and competition for talent also play a part.
What factors affect how much a job pays?
The U.S. Chamber of Commerce lists job responsibilities, required skills and certifications, experience, education, market demand and geographic location. Company finances and competitors' pay add to that. Together they decide both the range for the job and your place in it.
Is there a minimum salary employers must pay?
There is a federal minimum wage of $7.25 per hour for covered non-exempt employees, and states can set their own rules. The amount you receive can never be below the federal requirement. Your state labor department can tell you the current rate that applies to you.
What is a salary range, and where do I fall in it?
A salary range has a minimum, a midpoint and a maximum for a job. Newer, less experienced workers generally start nearer the bottom, and experienced workers sit further along. Dividing your pay by the midpoint gives your compa-ratio, where 1.0 means you are at midpoint.
Where can I find typical pay for my occupation?
The BLS Occupational Employment and Wage Statistics program reports wages at the 10th, 25th, 50th, 75th and 90th percentiles for hundreds of occupations by state and metro area. Salary Atlas presents that BLS data by job title and state with each figure linked to its source.
Sources
- DOL VETS: Salary Negotiations guide (January 2022)
- WorldatWork: Job Evaluation and Market-Pricing Practices (2009)
- U.S. Chamber of Commerce: How to Set Employee Salaries and Compensation
- OpenStax: Employee Compensation and Benefits
- Lehigh University HR: Market Referenced Job Evaluation Process
- University of Rochester: Pay Administrative Guidelines
- CompLogix: Salary Range Calculator
- UW-Madison HR: Determining Starting Salary of a New Hire
- SHRM: Salary Structures
- Employers Council: Compensation Planning
- IEEE Computer Society: Job Compensation
- LMI Institute: OEWS overview
- CareerOneStop: Salary Finder Help
- ASCM: Supply Chain Compensation Benchmarking
- NueCareer: HR generalist pay
- Chisholm Firm: Executive compensation nonprofit rules
Occupation wage figures on Salary Atlas come from the U.S. Bureau of Labor Statistics. Figures in this article that are not linked to a source are estimates. See our methodology.