$56,000 Gap: Elementary School Teacher Salary Varies by State (2026)

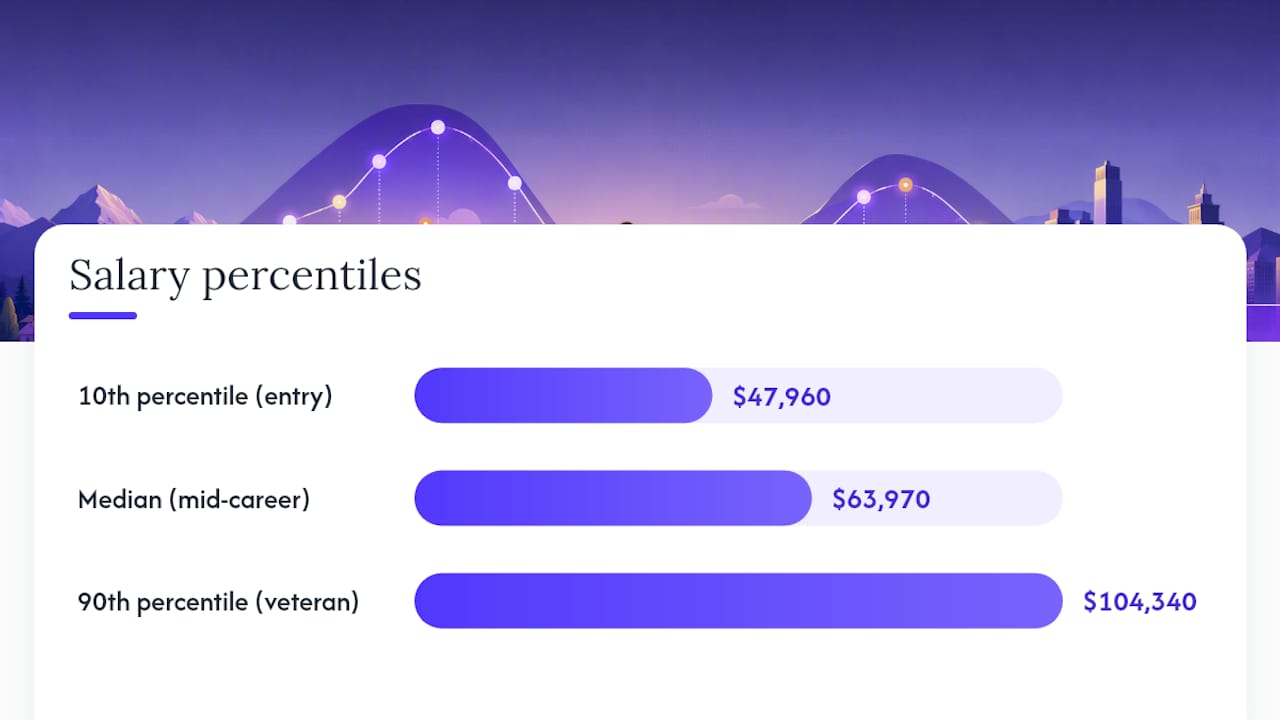
Elementary school teachers earn a median annual wage of $63,970, according to Bureau of Labor Statistics data, with the NEA reporting a 10th to 90th percentile spread of roughly $47,960 to $104,340. That range exists almost entirely because of two variables: which state and district you work in, and how many years you've been teaching.
*TL;DR:>
- Elementary teachers' salaries vary more than fifty thousand dollars between the 10th and 90th percentiles due to experience, education, and district factors.*
- State differences have a bigger impact on pay than national averages, with top-paying states like California and Massachusetts offering over double the median salaries of lower-paying states such as Mississippi.
- Public district pay scales follow a fixed step-and-lane schedule influenced by local funding, experience, education level, and additional certifications, rather than negotiation.
- Total compensation includes benefits like health insurance and retirement contributions, which can significantly increase the overall value of a salary offer.
- Private school salaries tend to be lower, but benefits like smaller class sizes and tuition discounts may offset lower pay; retirement and benefits structures differ markedly from public schools.
Table of Contents
- Elementary School Teacher Salary: National Median, Mean, and Percentiles
- Elementary Teacher Pay by State: The Biggest Driver of the Gap
- What Actually Drives Elementary Teacher Pay Scale Decisions
- How Elementary Teacher Salaries Grow From First Year to Retirement
- Reading a Salary Offer: Contract Length, Hourly Pay, and What's Missing
- Can Elementary School Teachers Negotiate Their Salary?
- Does Union Membership Change What Elementary Teachers Earn?
- Public vs. Private Elementary School Teacher Salaries
- What's Actually in an Elementary Teacher's Total Compensation Package
- An Editorial Take on Reading Elementary Teacher Salary Data
- Find Your Exact Number With Salary Atlas
- Where These Numbers Come From
- Sources
- FAQ
Elementary School Teacher Salary: National Median, Mean, and Percentiles
The $63,970 median from BLS OEWS data represents the middle point: half of elementary school teachers earn more, half earn less. That's a different number from the mean (average), which tends to run slightly higher because a smaller group of high earners in expensive districts pulls the average upward without moving the midpoint much.
Converted to an hourly equivalent for context, that median lands somewhere around $30 to $31 per hour for a standard contract year, though BLS itself notes this conversion is imperfect for education roles since most teachers don't work a traditional 40-hour, 52-week schedule.
The percentile breakdown tells the real story of who earns what:
- 10th percentile (~$47,960): Typically first-year teachers in lower-cost states or districts with thin funding.
- Median (~$63,970): A teacher with several years of experience in a mid-sized district, roughly the national middle.
- 90th percentile (~$104,340): Veteran teachers with 15+ years of service, advanced degrees, and jobs in high-cost states with strong local tax bases.
Pro Tip: When you see a salary figure quoted for elementary teachers, always check whether it's a median or a mean. A quoted "average" salary can be misleading in districts with a handful of long-tenured, high-step teachers skewing the number upward.
That spread of more than $56,000 between the bottom and top of the range isn't noise. It reflects genuinely different labor markets. A first-year teacher in a rural district and a 20-year veteran in a major metro area are technically doing similar jobs, but their pay trajectories look nothing alike, and the gap between them is where most of the "how much do elementary teachers make" confusion comes from.
Elementary Teacher Pay by State: The Biggest Driver of the Gap
If you want to understand why one person's "average elementary teacher salary" experience looks nothing like another's, stop looking at the national number and start looking at the state map. State medians vary by more than double from top to bottom, according to state ranking data compiled by NEA and BLS reporting.
States that consistently rank near the top include:
- Washington
- California
- The District of Columbia
- Massachusetts
- Rhode Island
States that rank near the bottom include:
- Oklahoma
- Mississippi
- Missouri
The gap between a high-ranking state and a low-ranking one can exceed tens of thousands of dollars a year for comparable experience levels. A teacher who relocates from a bottom-tier state to a top-tier one isn't just getting a modest raise. She's often crossing into an entirely different income bracket, even before adjusting for cost of living.
Three forces explain most of that spread:
- State funding formulas. Some states fund schools primarily through state income and sales tax revenue distributed by formula; others lean heavily on local property taxes, which means wealthy districts and poor districts within the same state can differ almost as much as two different states.
- Collective bargaining presence. States with strong teacher union representation and mandatory bargaining laws tend to post higher median salaries and more predictable raise schedules than states with weak or no collective bargaining rights for educators.
- Cost of living. High-paying states are often high-cost states. A $75,000 salary in Massachusetts and a $60,000 salary in Missouri may leave a teacher with surprisingly similar purchasing power once housing and taxes are factored in.
If you want your own state's exact numbers rather than a national range, Salary Atlas's state-by-state salary tool pulls directly from BLS OEWS tables and updates them annually, so you're comparing figures with the same methodology across every state rather than mixing sources.
What Actually Drives Elementary Teacher Pay Scale Decisions
Public school teacher pay isn't set by negotiation the way most private-sector salaries are. It runs on something called a step-and-lane salary schedule, and understanding it explains almost everything about how your paycheck will change over a career.
Here's how the system typically works:
- Steps represent years of service. Most districts publish a schedule where every additional year of experience automatically bumps your base pay, often by $500 to $2,000 depending on the district's budget.
- Lanes represent education level. A teacher with a master's degree sits in a different lane than one with only a bachelor's, and moving lanes (finishing a graduate program, adding an endorsement) usually triggers an immediate raise independent of years served.
- National Board Certification adds another layer in many districts and states, sometimes worth a flat stipend of several thousand dollars a year on top of the base schedule.
- District funding sets the ceiling. Two teachers on identical steps and lanes in different districts can earn very different salaries because one district's schedule simply starts and tops out higher, a direct function of local tax revenue and, per the Department of Labor, how state and federal funding streams get distributed.
Pro Tip: Before accepting or comparing job offers, ask for the district's published salary schedule, not just the number in the offer letter. That single document tells you exactly what raises to expect for the next 10 to 15 years, something almost no private-sector job will ever hand you in writing.
Cost of living and local tax base matter here too. A district in a high-cost metro area often has to set higher base pay just to compete for candidates, even if that means smaller raises elsewhere in the budget.

How Elementary Teacher Salaries Grow From First Year to Retirement
Entry-level elementary teacher salary typically starts near or below the 10th percentile mark, often in the $40,000 to $48,000 range depending on the state and district. From there, growth follows a fairly predictable curve tied to the step schedule described above.
- Years 1 to 5: Pay rises steadily through automatic step increases, usually the fastest percentage growth a teacher will see in their career.
- Years 6 to 15: Growth continues but slows unless the teacher adds a graduate degree, certification, or moves to a better-funded district.
- Years 15+: Teachers near the top of their district's schedule often see raises come mostly from cost-of-living adjustments and contract negotiations rather than step increases, since most schedules cap out.
The two moves that reliably produce bigger jumps than waiting for annual steps are switching districts (especially from a low-paying to a high-paying one) and moving into a leadership or specialist role, such as instructional coach or department lead, which often comes with its own pay lane. Completing additional graduate credits or earning a relevant endorsement remains one of the few pay increases a teacher can control directly rather than waiting on district budgets or negotiations.
Reading a Salary Offer: Contract Length, Hourly Pay, and What's Missing
One of the most common mistakes when comparing "how much do elementary teachers make" figures is treating every quoted number as equivalent. It rarely is.
- Check the contract length first. Most teaching salaries are quoted for a 9 or 10-month contract, not 12 months. A district offering $52,000 over 10 months isn't necessarily lower-paying than one offering $58,000 over 12, once you calculate the per-month rate.
- Treat hourly equivalents carefully. BLS reports an hourly wage figure for teachers, but it's a rough conversion built for statistical comparison across occupations, not a reflection of how teacher time actually gets compensated (grading and prep rarely show up on a time clock).
- Add non-salary compensation before comparing offers. Health insurance premiums covered by the district, retirement contributions (often through a state pension system), and stipends for coaching, tutoring, or extra duties can shift the real value of an offer by thousands of dollars.
- Build a simple side-by-side checklist: base salary, contract months, health premium coverage, retirement match or pension formula, and any recurring stipends. Districts that look identical on base pay alone can differ significantly once you total the package.
Can Elementary School Teachers Negotiate Their Salary?
Negotiation in public education looks nothing like negotiation in the private sector, and that catches a lot of career changers off guard. Base salary on a published step-and-lane schedule is almost never negotiable line by line. What a district offers for your years of experience and education lane is typically fixed by policy, not by how well you interview.
Where real negotiation room exists is narrower but still worth pursuing. Districts sometimes have flexibility on which step you're placed at if you're bringing relevant outside experience (tutoring, substitute teaching, private school years) that wasn't automatically credited. Stipends for coaching, club advising, or additional duties are frequently negotiable add-ons layered on top of base pay. Signing bonuses have also become more common in districts facing teacher shortages, particularly in high-need subjects or hard-to-staff schools.
The most effective leverage a teacher has isn't haggling over the offer in hand. It's collecting competing offers from neighboring districts with different pay scales and using them as evidence when requesting a step reevaluation, or timing a move to coincide with contract renewal periods when schedules get revisited. Union representatives, where present, often know exactly which parts of a schedule have flexibility and which don't, making them a genuinely useful resource before you assume an offer is final.
Does Union Membership Change What Elementary Teachers Earn?
Union presence correlates with meaningfully different pay outcomes, and the mechanism is straightforward: collective bargaining agreements typically lock in the step-and-lane schedule itself, plus annual cost-of-living adjustments, health insurance contributions, and grievance protections that non-union districts negotiate case by case, or not at all.
States with strong mandatory bargaining laws for educators tend to cluster toward the higher end of the state pay rankings, though that correlation reflects overlapping factors, stronger union states often also have higher costs of living and larger tax bases, not union membership as a standalone cause. Still, the predictability itself is real. A union contract usually means every teacher in the district can look up exactly what a first-year hire with a master's degree earns, versus a district where pay depends more on individual negotiation or administrative discretion.
Benefits track a similar pattern. Union contracts frequently specify the district's minimum contribution toward health insurance premiums and retirement matching, protections that are harder to secure without collective bargaining. Non-union or "right-to-work" states don't automatically mean lower pay, some rank respectably on the state tables, but they generally mean more variability district to district, since there's no baseline contract setting the floor.
Public vs. Private Elementary School Teacher Salaries
Public school figures dominate the national conversation because that's what BLS OEWS and NEA data primarily track, but private school pay follows a different logic entirely.
Private elementary schools aren't bound by state-mandated step-and-lane schedules, which means pay can be more individually negotiated, but that flexibility usually cuts against teachers rather than for them. Private school teacher salaries tend to run lower than public median figures, often by a noticeable margin, largely because private schools operate on tuition and endowment revenue rather than the property and income tax base that funds public districts.
What private schools sometimes offer instead is smaller class sizes, tuition discounts or waivers for teachers' own children, and more autonomy over curriculum, benefits that don't show up in a salary figure but factor into many teachers' actual decision to accept a lower-paying private role. Retirement benefits are the area where the gap widens most: public school teachers typically participate in a state pension system with defined benefits, while private school teachers more often get a 401(k)-style plan with a smaller district match, if any match at all.
Anyone comparing a public offer to a private one needs to weigh base pay, retirement structure, and health coverage together rather than looking at salary alone. A private school offer that looks close to a public one on paper can end up worth considerably less once retirement contributions are factored in over a full career.
What's Actually in an Elementary Teacher's Total Compensation Package
Base salary is only part of the picture, and it's often not even the largest part once you account for benefits that don't show up in a BLS wage table.
Health insurance is usually the biggest non-salary line item. Most public districts cover a significant share of premium costs for teachers and often extend that coverage to dependents at a subsidized rate, a benefit that can be worth $8,000 to $15,000 a year or more depending on the plan and family size. Retirement benefits matter just as much over a career: the majority of public school teachers participate in a state-administered pension system with a defined benefit formula, a structure increasingly rare outside government and education work.

Beyond those two big items, typical packages include stipends for extra duties (coaching, club sponsorship, department leadership), tuition reimbursement for graduate coursework that can also move a teacher up a pay lane, and in some districts, signing or retention bonuses tied to shortage subjects or hard-to-staff schools. Paid time off tends to be more generous than private-sector norms too, with summers off being the obvious example, even though that time isn't compensated the same way a 12-month salary would be.
None of this shows up in a headline salary figure, which is exactly why comparing two job offers by base pay alone almost always produces the wrong conclusion.
An Editorial Take on Reading Elementary Teacher Salary Data
The mistake I see most often is treating the national median as a personal benchmark. It isn't. Your real number lives in your state's ranking table and your district's step schedule, not in a BLS national average.
Look up your district's actual schedule, price in the benefits, and use state data to set honest relocation expectations before you assume a bigger number elsewhere means a better deal.
— Joelen Zyoktova
Find Your Exact Number With Salary Atlas
Every figure in this article traces back to BLS OEWS data, but the national median only gets you so far when you're deciding whether a specific district's offer is fair. Salary Atlas exists to close that gap: no paywall, no signup wall, no averages pulled from job postings or self-reported surveys that drift from what BLS actually measures.
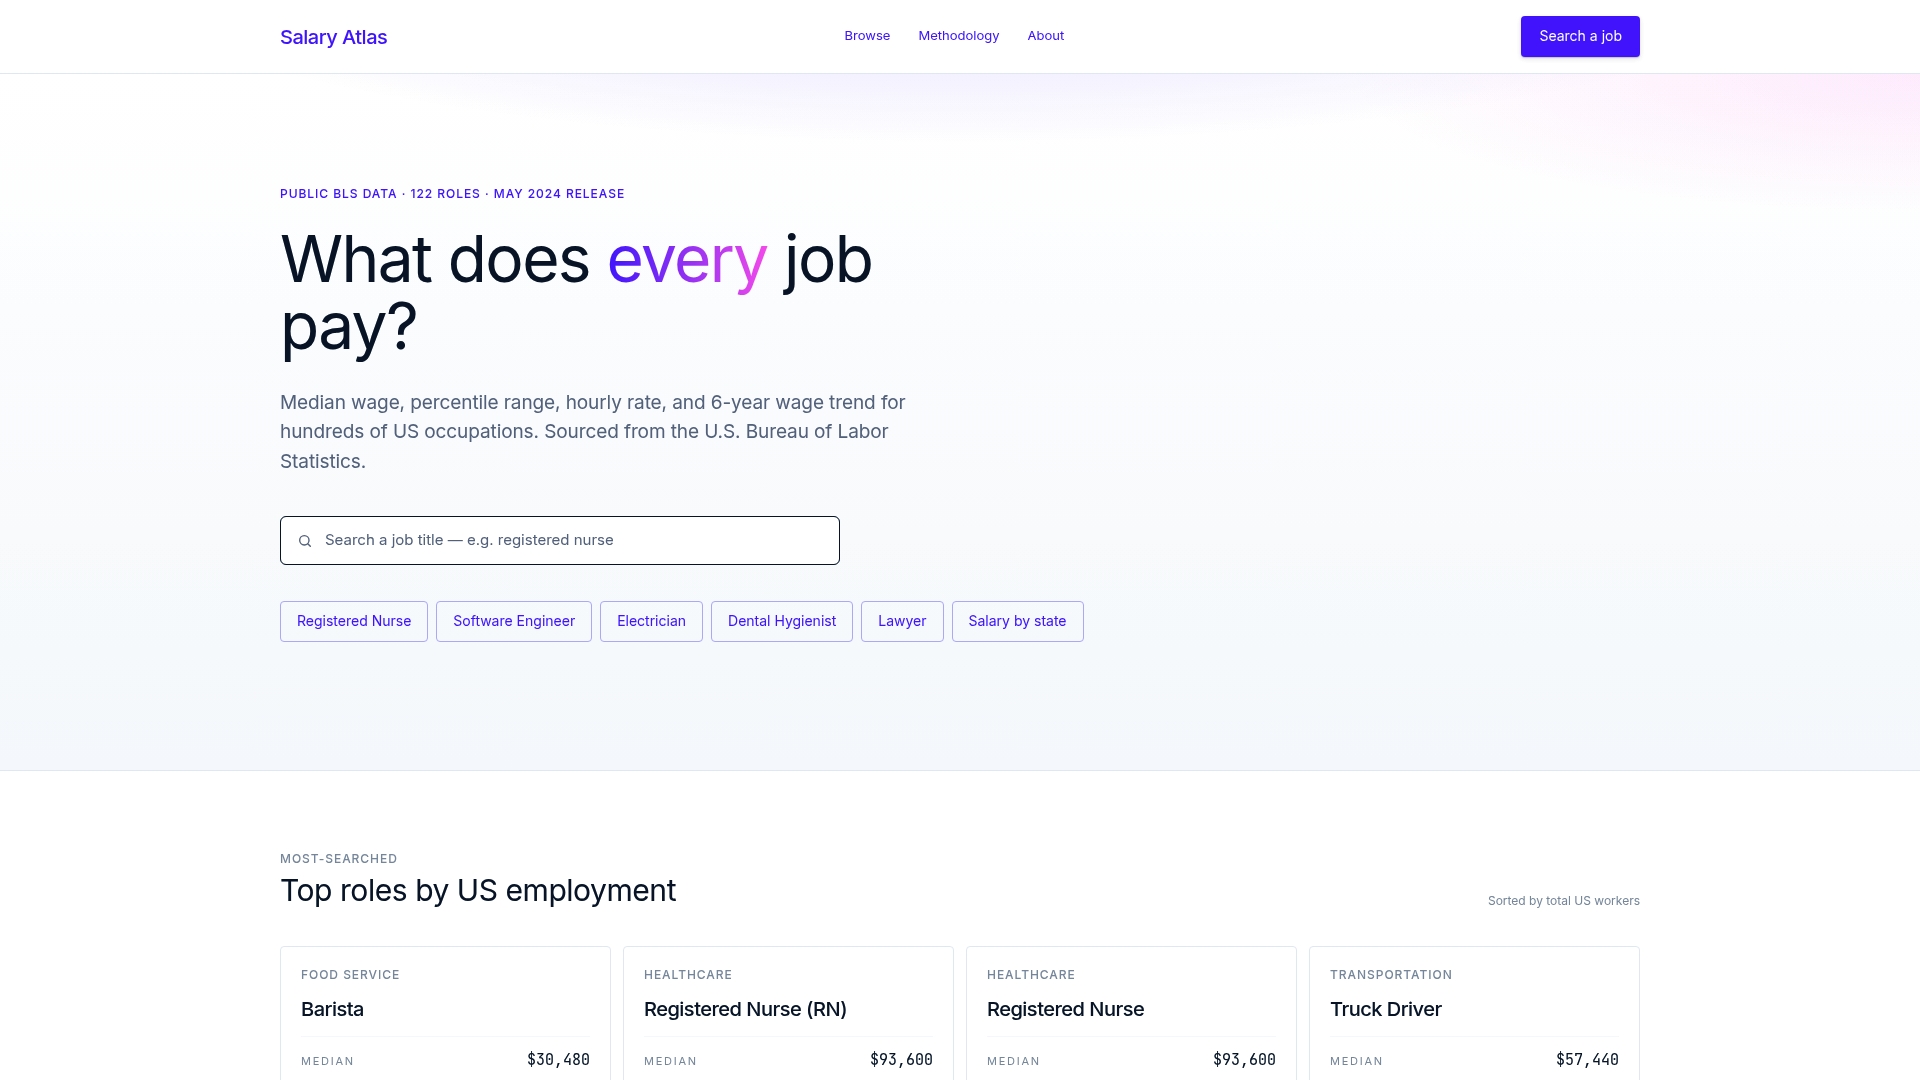
The Salary Atlas elementary teacher salary page breaks the national figures down into state medians, percentile ranges, and multi-year trends, so you can see exactly where your state and experience level fall rather than guessing from a single national number. If you're weighing a move, the salary-by-state tool lets you pull any state's BLS-sourced figures side by side before you start applying. Check your state's table today and see where your current or prospective district actually lands.
Where These Numbers Come From
- NEA for state rankings built on BLS figures
- EPI for long-term teacher pay trend analysis
- USAFacts for context on why private-site averages differ
Sources
Salary Atlas builds its elementary teacher salary figures directly from BLS OEWS occupational and state wage tables, refreshed on an annual cadence to match BLS's own release schedule.
- Educator Pay Data 2026 | NEA
- How much do teachers get paid in the US? | USAFacts
- The teacher pay penalty reached a record high in 2024 | EPI
The reported national median stands at $63,970, sourced from the same BLS OEWS release the NEA cites in its own educator pay rankings. Readers who want to pull the raw tables themselves can do so directly from BLS or cross-reference NEA's state comparisons; nothing in this article requires taking a single source's word for it.
FAQ
What state pays elementary school teachers the most?
Washington, California, the District of Columbia, Massachusetts, and Rhode Island consistently rank among the highest-paying states for elementary school teachers based on NEA and BLS data.
What percentage of teachers make $100,000?
Roughly 10% of elementary school teachers nationally earn at or above the 90th percentile mark of about $104,340, typically veteran teachers with advanced degrees in high-paying states.
Are teachers well paid in the United States?
Compared to other college-educated professions, teacher pay lags meaningfully. EPI's analysis found the teacher pay penalty reached a record high in 2024, meaning teachers earn less than similarly educated workers in other fields.
Why do salary sites like Indeed or Glassdoor show different numbers than BLS?
Aggregator sites often rely on self-reported salaries or job-posting data, which produces different averages than BLS's employer-collected OEWS survey; BLS figures are generally more reliable for cross-state comparisons.
How much more do experienced elementary teachers earn than starting teachers?
The gap between entry-level pay near $47,960 and top-tier veteran pay near $104,340 exceeds $56,000 annually, driven mainly by step schedule increases, lane changes, and district location.