Minimum Wage by State in 2026: What Applies to You
 *
*
TL;DR:>
- Most U.S. workers are covered by state or local minimum wages higher than the federal $7.25 hourly rate. The highest rates in 2026 include D.C. at $17.00 and Washington State at $16.00 statewide, with local rates exceeding that. Employers and workers should verify the highest applicable wage, considering local ordinances, employer size, and job classification.*
The federal minimum wage is $7.25 per hour and has not changed since 2009. That floor matters less than it once did. More than 30 states and the District of Columbia have set higher statutory minimums, and dozens of cities layer additional local rates on top of those. In practice, the rate that governs your paycheck or your payroll is almost always a state or city number, not the federal one.
The table below lists every state's current statutory minimum, its effective date, and any tipped or youth subminimum that applies. Use it to find the exact figure for your location, then read the sections that follow to confirm which rate legally controls your situation.
 *
*
Table of Contents
- Minimum wage by state: 2026 statutory rates
- Which minimum wage actually applies to you?
- Minimum wage vs. living wage vs. median wage: which number should you use?
- How to use wage data for negotiation and payroll
- Where these numbers come from and how often they update
- Key Takeaways
- The case for transparent wage data
- Salary Atlas gives you the full wage picture, not just the floor
- Useful sources
- FAQ
Minimum wage by state: 2026 statutory rates
The U.S. Department of Labor's consolidated minimum wage table is the primary source for the figures below. Effective dates reflect the DOL table as of July 1, 2026. Tipped rates and youth/training subminimums are included where the state sets them; a dash means the state does not publish a separate rate for that category.
| State / Territory | Hourly minimum | Effective date | Tipped rate | Youth/training rate | Notes |
|---|---|---|---|---|---|
| Alabama | $7.25 | — | — | — | No state law; federal rate applies |
| Alaska | has a minimum wage higher than the federal minimum | Jan 1, 2026 | — | — | — |
| Arizona | has a minimum wage higher than the federal minimum | Jan 1, 2026 | $11.70 | — | — |
| Arkansas | has a minimum wage higher than the federal minimum | — | $2.63 | — | — |
| California | has a minimum wage higher than the federal minimum | Jan 1, 2026 | — | — | Fast-food workers: $20.00; healthcare sector: higher |
| Colorado | has a minimum wage higher than the federal minimum | Jan 1, 2026 | $11.79 | — | Denver has higher local rate |
| Connecticut | has a minimum wage higher than the federal minimum | Jan 1, 2026 | $8.23 | — | — |
| Delaware | has a minimum wage higher than the federal minimum | — | $2.23 | — | — |
| District of Columbia | has a minimum wage higher than the federal minimum | Jul 1, 2026 | $10.00 | — | Highest in the U.S. |
| Florida | has a minimum wage higher than the federal minimum | — | $10.98 | — | Scheduled to reach $15.00 |
| Georgia | in practice follows the federal minimum rate | — | $2.13 | — | Federal rate applies in practice |
| Hawaii | has a minimum wage higher than the federal minimum | Jan 1, 2026 | $12.75 | — | — |
| Idaho | in practice follows the federal minimum rate | — | $3.35 | — | Federal rate applies |
| Illinois | has a minimum wage higher than the federal minimum | — | $9.00 | $13.00 | Chicago: higher local rate |
| Indiana | in practice follows the federal minimum rate | — | $2.13 | — | Federal rate applies |
| Iowa | in practice follows the federal minimum rate | — | $4.35 | — | Federal rate applies |
| Kansas | in practice follows the federal minimum rate | — | $2.13 | — | Federal rate applies |
| Kentucky | in practice follows the federal minimum rate | — | $2.13 | — | Federal rate applies |
| Louisiana | in practice follows the federal minimum rate | — | — | — | No state law; federal rate applies |
| Maine | has a minimum wage higher than the federal minimum | Jan 1, 2026 | $7.33 | — | Portland: higher local rate |
| Maryland | has a minimum wage higher than the federal minimum | — | $3.63 | — | Montgomery County: higher |
| Massachusetts | has a minimum wage higher than the federal minimum | — | $6.75 | — | — |
| Michigan | has a minimum wage higher than the federal minimum | — | $4.01 | — | Scheduled increases |
| Minnesota | has a minimum wage higher than the federal minimum | Jan 1, 2026 | — | — | Large employers: $11.13; small: $9.08 |
| Mississippi | in practice follows the federal minimum rate | — | — | — | No state law; federal rate applies |
| Missouri | has a minimum wage higher than the federal minimum | Jan 1, 2026 | $6.88 | — | — |
| Montana | has a minimum wage higher than the federal minimum | Jan 1, 2026 | — | — | — |
| Nebraska | has a minimum wage higher than the federal minimum | Jan 1, 2026 | $2.13 | — | — |
| Nevada | has a minimum wage higher than the federal minimum | Jul 1, 2024 | — | — | — |
| New Hampshire | $7.25 | — | $3.27 | — | Federal rate applies |
| New Jersey | has a minimum wage higher than the federal minimum | Jan 1, 2026 | $5.26 | — | Small employers: $13.73 |
| New Mexico | has a minimum wage higher than the federal minimum | — | $3.00 | — | Albuquerque: higher local rate |
| New York | has a minimum wage higher than the federal minimum | Jan 1, 2026 | $13.35 | — | NYC/Nassau/Suffolk/Westchester: $17.00; remainder: $16.00 |
| North Carolina | $7.25 | — | $2.13 | — | Federal rate applies |
| North Dakota | $7.25 | — | $4.86 | — | Federal rate applies |
| Ohio | has a minimum wage higher than the federal minimum in some cases | Jan 1, 2026 | $5.25 | — | Small employers: $7.25 |
| Oklahoma | $7.25 | — | $2.13 | — | Federal rate applies |
| Oregon | has a minimum wage higher than the federal minimum | Jul 1, 2026 | — | — | Portland metro: $15.95; nonurban: $13.70 |
| Pennsylvania | $7.25 | — | $2.83 | — | Federal rate applies |
| Rhode Island | has a minimum wage higher than the federal minimum | — | $3.89 | — | — |
| South Carolina | $7.25 | — | — | — | No state law; federal rate applies |
| South Dakota | has a minimum wage higher than the federal minimum | Jan 1, 2026 | $5.60 | — | — |
| Tennessee | $7.25 | — | — | — | No state law; federal rate applies |
| Texas | $7.25 | — | $2.13 | — | Federal rate applies |
| Utah | $7.25 | — | $2.13 | — | Federal rate applies |
| Vermont | has a minimum wage higher than the federal minimum | Jan 1, 2026 | $7.01 | — | — |
| Virginia | has a minimum wage higher than the federal minimum | Jan 1, 2026 | $2.13 | — | — |
| Washington | has a minimum wage higher than the federal minimum | Jan 1, 2026 | — | — | SeaTac: $19.06 |
| West Virginia | has a minimum wage higher than the federal minimum | — | $2.62 | — | — |
| Wisconsin | $7.25 | — | $2.33 | — | Federal rate applies |
| Wyoming | $5.15 | — | $2.13 | — | Federal rate applies in practice |
- New York sets $17.00/hour for NYC, Nassau, Suffolk, and Westchester counties, with the rest of the state at $16.00.
- Oregon runs three tiers: Portland metro at $15.95, standard at $14.70, and nonurban counties at $13.70.
- Minnesota separates large employers (annual revenue over $500,000) from small ones, with different rates for each.
- New Jersey applies a lower rate for employers with fewer than six employees.
Which minimum wage actually applies to you?
The answer-first rule: the highest applicable rate controls. Local ordinances beat state law; state law beats federal. But coverage rules and exemptions can flip that hierarchy, so the checklist matters.
For employers and workers, run through these four checks:- FLSA coverage. The Fair Labor Standards Act covers most private-sector employers with annual revenue of $500,000 or more, plus any business engaged in interstate commerce. If the FLSA applies, the federal floor is the baseline, but a higher state or local rate still wins.
- Employer size. Several states, including Minnesota and New Jersey, set different rates based on employer size or revenue. Confirm your threshold before assuming the headline rate applies.
- Job classification. Tipped workers, youth employees (under 20 during a 90-day training period under federal rules), and certain student workers may qualify for subminimum rates. The federal tipped minimum is $2.13/hour, but the employer must make up the difference if tips don't bring the worker to $7.25.
- Local ordinances. Cities like Seattle, Chicago, and Washington D.C. set rates above their state floors. SeaTac, Washington, for example, requires $19.06/hour for certain hospitality and transportation workers. State preemption laws in some states block cities from going higher, so check whether your state allows local ordinances.
Minimum wage vs. living wage vs. median wage: which number should you use?
These three figures measure different things, and mixing them up leads to bad decisions.
Statutory minimum wage is a legal floor set by government. It tells you the least an employer can legally pay. It says nothing about whether that amount covers rent. Living wage is a cost-of-living estimate, not a law. The MIT Living Wage Calculator produces county-level figures that reflect actual costs for food, housing, childcare, healthcare, and transportation. In high-cost metros, MIT's living wage estimate for a single adult can run well above $20/hour, while the statutory minimum in the same state might be $15.00. The Global Living Wage Coalition frames it precisely: minimum wage is a political and legal instrument; living wage is a data-driven, normative estimate. Both aim to reduce poverty, but they are set by entirely different processes. Median wage is what the middle worker in a given occupation actually earns. Because high earners pull up the average, the Social Security Administration confirms that median wages tend to sit below mean wages. For benchmarking what a typical person in a role earns, median is the right number.A quick illustration: imagine a small metro where five workers in a role earn $12, $14, $15, $22, and $60 per hour. The mean is $24.60. The median is $15.00. The statutory minimum might be $13.75. The MIT living wage estimate for that county might be $18.50. Each number is accurate; each answers a different question. Median income is the more representative benchmark for what a typical worker earns, precisely because it isn't skewed by the $60/hour outlier.
For job seekers, use the statutory minimum to know your floor, the MIT calculator to assess whether an offer covers your actual costs, and BLS median figures to negotiate toward market rate. For employers, statutory minimums set your legal baseline; median and percentile data from BLS OEWS tell you where your pay bands need to sit to attract and retain workers.
*How to use wage data for negotiation and payroll
For job seekers: a negotiation checklist- Look up the statutory minimum for your state and city. That's your absolute floor.
- Find the BLS median wage for your occupation and state. That's your target anchor.
- Run the MIT Living Wage Calculator for your county. If the offer falls below that figure, factor it into your decision.
- Calculate the annual impact: a $1/hour difference on a 40-hour week is roughly $2,080 per year before taxes.
- In the negotiation, cite the median wage for your role and location, not the minimum. "The BLS median for this role in this state is $X" is a stronger anchor than "the minimum wage is $Y."
- Confirm the highest applicable statutory rate (local, state, or federal) for every work location.
- Check employer-size thresholds and any tipped or training subminimum rules that apply.
- Pull the 25th, 50th, and 75th percentile wages from BLS OEWS for the occupation and state. Set entry-level pay at or above the 25th percentile; mid-level at the median; senior roles at or above the 75th.
- Factor in overtime: the FLSA requires 1.5x the regular rate for hours over 40 per week for covered, non-exempt employees.
- Document the rate, the source, and the effective date in your payroll system.
Where these numbers come from and how often they update
Figures in the state table above are compiled from the U.S. Department of Labor's consolidated minimum wage table and cross-checked against individual state labor department pages. The DOL table reflects effective dates as of July 1, 2026.
| Source | What it covers | Update cadence |
|---|---|---|
| U.S. DOL consolidated table | Statutory minimums, tipped rates, effective dates for all states and territories | Updated when state laws change |
| State labor department pages | Local ordinances, employer-size tiers, subminimum categories | Varies by state; check annually |
| BLS OEWS | Occupation-level median and percentile wages by state | Annual (May survey data) |
| MIT Living Wage Calculator | County-level cost-of-living wage estimates | Annual |
| Salary Atlas | State-filtered occupation medians, 6-year trends, downloadable CSVs | Annual, cross-linked to BLS OEWS |
- Phased increases are shown at the rate in effect on the effective date listed; future scheduled increases are noted where known but should be confirmed with the state labor department.
- Tiered local rates (New York, Oregon, Minnesota, New Jersey) are flagged in the table but are not exhaustive. City-level ordinances change frequently.
- Tipped and youth subminimum rates reflect state law; some cities set higher floors for tipped workers.
- Salary Atlas refreshes occupation-level data annually following the BLS OEWS May release. See the Salary Atlas methodology for full details on data processing.
Key Takeaways
The federal minimum wage of $7.25/hour is the legal floor, but state and local rates are what actually govern most U.S. workers and employers in 2026.
| Point | Details |
|---|---|
| Federal floor is $7.25 | The federal rate has not changed since 2009; most states and cities set higher statutory minimums. |
| Highest rate controls | Local ordinances override state law; state law overrides federal. Always apply the highest applicable rate. |
| Tipped and size exemptions matter | Employer size, job classification, and tipped status can change the rate; verify before processing payroll. |
| Median beats mean for benchmarking | Use BLS median wages, not averages, to benchmark typical pay; high earners skew the mean upward. |
| Salary Atlas for occupation data | Salary Atlas publishes state-filtered BLS OEWS medians and downloadable CSVs, free and source-linked. |
The case for transparent wage data
Minimum wage debates tend to generate heat but not much light. The number that actually matters to a worker in Seattle is not the federal $7.25 or even Washington's $16.66 statewide rate. It's the SeaTac $19.06 or the Seattle city rate, depending on where they clock in. The gap between the federal floor and real local rates has grown so wide that the federal number is nearly irrelevant for most workers. Yet it still anchors public debate.
What I find more useful, and what Salary Atlas is built around, is pairing the statutory floor with occupation-level median data. A statutory minimum tells you the least you can legally be paid. A BLS median tells you what the market actually pays for your skills. The distance between those two numbers is where negotiation lives. For a data analyst or a professor, the minimum wage is a distant abstraction. For a food service worker or a retail associate, it's the number on their pay stub. Both deserve access to the same quality of wage data, without a paywall.
The other thing worth saying plainly: living-wage estimates from MIT are not a legal standard, but they are a useful reality check. When a state minimum sits $6 or $7 below what MIT calculates a single adult needs to cover basic costs in that county, the statutory minimum is doing less work than its proponents claim. That gap is worth knowing, whether you're negotiating a raise or setting a pay band.
*Salary Atlas gives you the full wage picture, not just the floor
The statutory minimum is the starting point. What you actually need, whether you're a job seeker building a negotiation case or an HR team setting pay bands, is occupation-level median data filtered by state, broken down by experience percentile, and tied directly to its source.
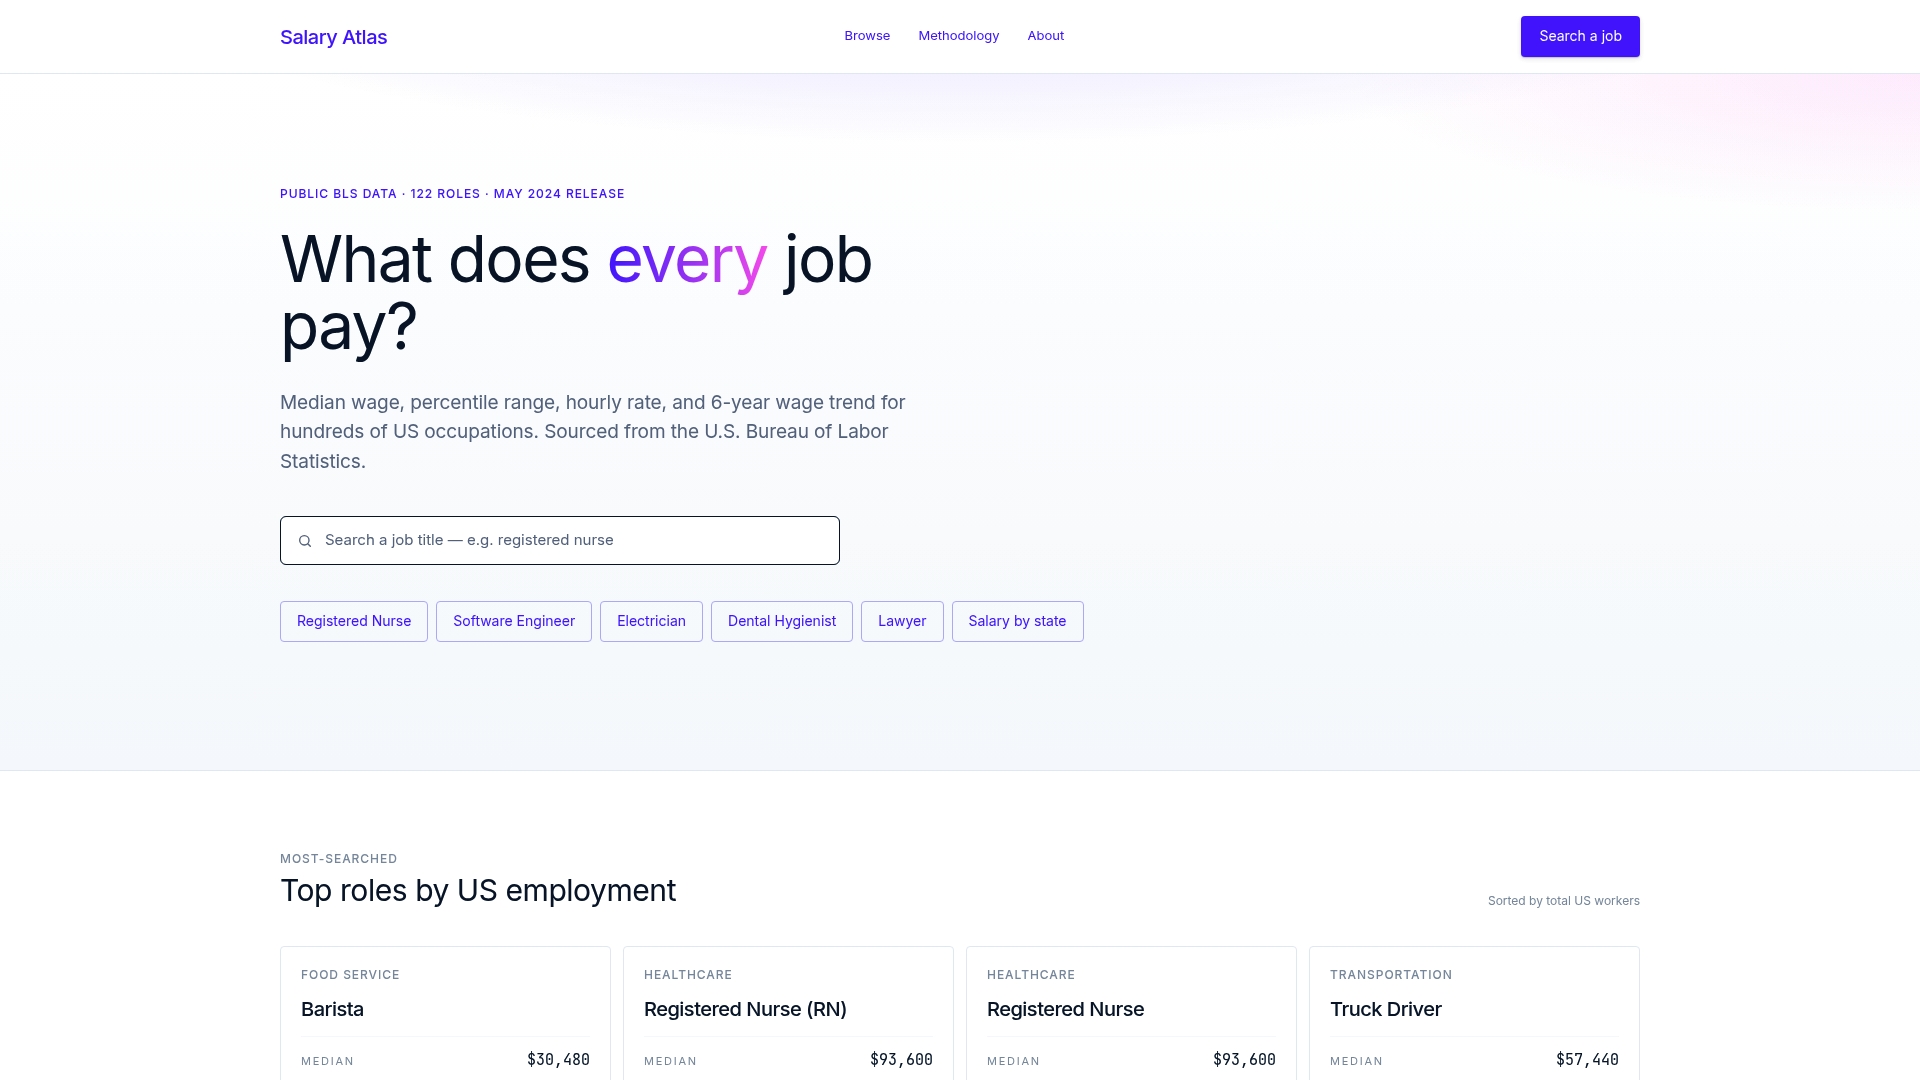
Salary Atlas publishes exactly that: BLS OEWS median wages by job title and state, 6-year trend lines, and downloadable CSVs, all free and linked back to the original government data. No paywall, no signup, no fabricated figures. The average salary by state page lets you filter by occupation and location in seconds. If you want the full dataset, the CSV download is on the same page. Start with the statutory minimum from the table above, then pull the occupation median from Salary Atlas to see where the market actually sits.
*Useful sources
Primary sources for statutory rates, living-wage estimates, and median wage data:
- U.S. Department of Labor — Consolidated Minimum Wage Table: The authoritative federal source for statutory minimums, tipped rates, and effective dates across all states and territories.
- U.S. Department of Labor — State Minimum Wage Laws: State-by-state detail pages with employer-size rules, exemptions, and links to state labor departments.
- MIT Living Wage Calculator: County-level cost-of-living wage estimates for 12 family configurations; useful for assessing whether an offer covers actual local costs.
- BLS Occupational Employment and Wage Statistics (OEWS): Annual median and percentile wages by occupation and state; the benchmark source for pay-band setting.
- National Conference of State Legislatures — State Minimum Wages: Legislative tracking of state minimum wage changes, scheduled increases, and preemption rules.
Bookmark your state's labor department page alongside the DOL consolidated table. Rates change on different schedules, and a city ordinance can take effect mid-year without a federal or state update. *
FAQ
What is the federal minimum wage in 2026?
The federal minimum wage remains $7.25 per hour, unchanged since 2009. Most states and many cities set higher statutory floors that override this rate.
Which state has the highest minimum wage?
The District of Columbia leads at $17.00/hour as of July 1, 2026. Among states, Washington ($16.00 statewide, $19.06 in SeaTac), California ($16.00 statewide, higher rates for fast-food and healthcare), and New York ($17.00 in NYC and surrounding counties, $16.00 elsewhere) are at the top.
How does a living wage differ from a minimum wage?
A minimum wage is a legal floor set by government; a living wage is a cost-based estimate of what a worker needs to cover basic expenses in a given location. The MIT Living Wage Calculator produces county-level figures that often exceed statutory minimums in high-cost areas.
Should I use mean or median wage when benchmarking pay?
Use the median. Because high earners pull up the average, the mean overstates what a typical worker in a role earns. The Social Security Administration confirms median wages tend to sit below mean wages for this reason.
Where can I find occupation-level wage data by state?
Salary Atlas publishes BLS OEWS median wages by job title and state, with 6-year trends and downloadable CSVs, free at salary-atlas.com/salary-by-state.
* This article provides general wage information for educational purposes. Confirm current statutory rates with your state labor department or a qualified employment attorney before making payroll or compensation decisions.