Nurse Hourly Pay in 2026: Rates, Ranges & State Data

Registered nurses in the U.S. earn a median of roughly $45.00 per hour, based on the Bureau of Labor Statistics' May 2024 data, which puts annual pay at $93,600. That median sits in the middle of a wide band: Indeed's dataset of 250,000+ salary samples shows a typical range from about $29.53 to $66.81 per hour, with an average of $44.41. Where you land in that range depends heavily on state, specialty, and years of experience.
Key figures at a glance:
- Median RN hourly wage: ~$45.00/hr (BLS, May 2024)
- Typical range: $29.53–$66.81/hr (Indeed, 250k+ samples)
- Entry-level (10th percentile): closer to $30/hr
- Top earners (90th percentile): $60/hr and above
- Primary sources used: Salary Atlas RN data, BLS/OES, Indeed
Entry-level nurses cluster near the lower end of that range; nurses with a decade of experience, specialty certifications, or positions in high-demand states routinely push into the upper quartile.
Key Takeaways
Registered nurses in the U.S. earn a median hourly wage nationally, but state, specialty, and schedule differences can lead to significant variation in actual pay. Total compensation including shift differentials, overtime, and bonuses can meaningfully exceed base pay. Salary Atlas provides free, BLS-sourced percentile and state breakdowns to help benchmark any offer.
Table of Contents
- What does nurse hourly pay look like nationally?
- How does RN hourly pay vary by state?
- What factors actually drive your hourly rate up or down?
- How do you convert an annual salary to an hourly rate?
- Overtime, shift differentials, and what total compensation really looks like
- What does the job outlook mean for RN wages?
- Where do these numbers come from?
- How to use this data when evaluating or negotiating an offer
- The numbers tell you where you stand — what you do with them is the real work
- Salary Atlas gives you the state and percentile data to negotiate with confidence
- Useful sources
- FAQ
What does nurse hourly pay look like nationally?
The median and mean tell different stories, and both matter. The BLS median of $45.00/hr means half of all RNs earn more and half earn less. The mean (arithmetic average) tends to run slightly higher because top earners in specialties like anesthesia pull it upward.
| Percentile | Estimated Hourly Rate |
|---|---|
| 10th | ~$30/hr |
| 25th | ~$36/hr |
| 50th (median) | ~$45/hr |
| 75th | ~$55/hr |
| 90th | ~$66.81/hr |
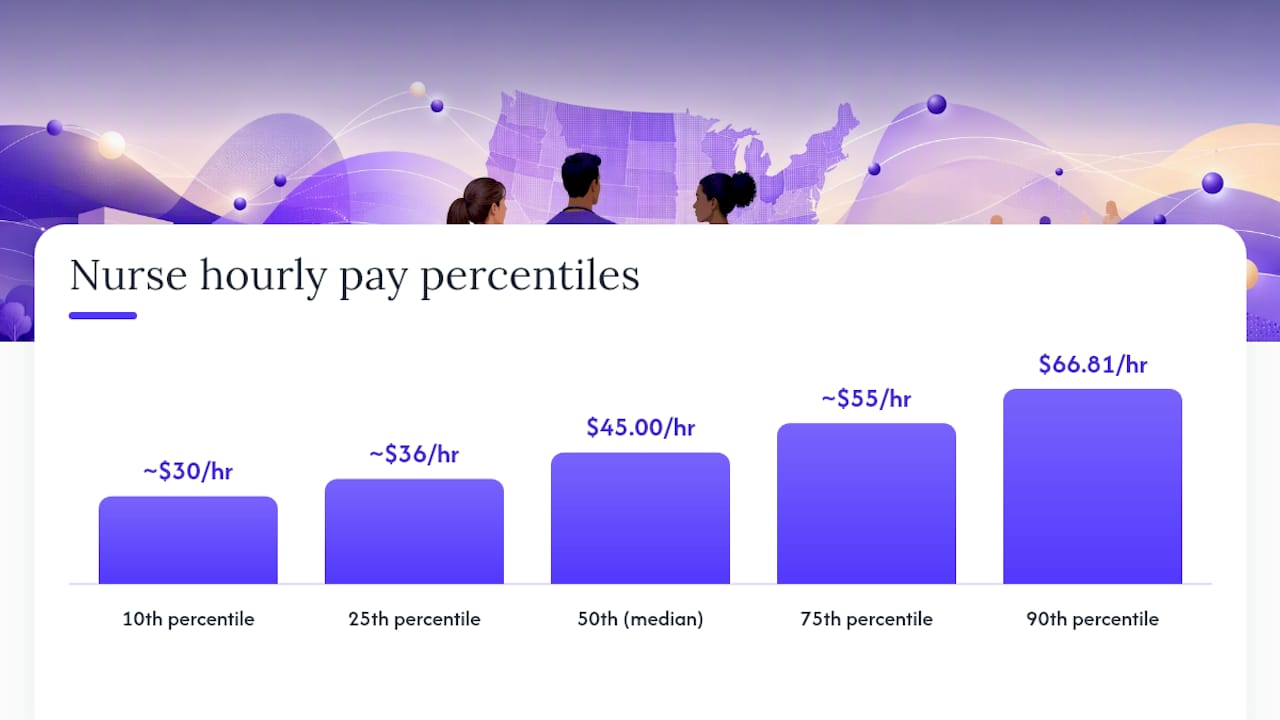 Estimates derived from BLS OES May 2024 annual figures converted at 2,080 hours/year.
PayScale's self-reported sample/Hourly_Rate?loggedIn=) shows a lower average of $37.17/hr, with a typical range of $29–$51. That gap versus Indeed's $44.41 average reflects a real methodological difference: job-posting aggregators like Indeed capture advertised wages (which skew toward open, often higher-paying positions), while profile-based sites like PayScale collect what nurses actually report earning today.
Overtime and bonuses add meaningfully to base pay. Glassdoor data shows median additional pay (bonuses, overtime, and other extras) reaching roughly $13,000 per year in some markets, which can push effective total compensation well above what the base hourly rate implies.
How does RN hourly pay vary by state?
State medians for registered nurses vary widely between the lowest and the highest-paying markets. Several forces drive that spread: local cost of living, the mix of public vs. private payers, union density, scope-of-practice laws, and raw supply-demand imbalances in the nursing workforce.

Specific state median salaries and hourly rates vary; for exact figures, refer to the BLS OES May 2024 data or similar authoritative sources.
A compact regional sample shows how wide the gap gets:
State-level median salaries and hourly rate estimates vary; for current and detailed data please consult the BLS OES May 2024 data.
Pro Tip: A high state median doesn't automatically mean higher take-home pay. California's $64/hr median looks dominant until you factor in state income tax rates and housing costs. Use the Salary Atlas salary-by-state tool alongside a cost-of-living index to compare real purchasing power across states before accepting a relocation offer.What factors actually drive your hourly rate up or down?
Several variables move the needle on RN hourly pay, and knowing which ones you can control is the starting point for any negotiation.
- Work setting: — Hospital-based acute care typically pays more than outpatient clinics, long-term care, or school nursing. Academic medical centers and Level I trauma centers tend to pay at or above market.
- Geographic location: — As the state data above shows, location alone can move your hourly rate by $30/hr or more.
Watch for these red flags in job offers: vague language about overtime eligibility, shift differentials listed as "up to" rather than guaranteed, and benefits packages that omit retirement matching or cap PTO accrual in the first year.
How do you convert an annual salary to an hourly rate?
The standard formula assumes a 40-hour workweek and 52 weeks per year, giving 2,080 paid hours annually.
Formula: Annual salary ÷ 2,080 = hourly rateNursing schedules often differ from that standard, so the math changes depending on your actual hours.
- Full-time, 40-hour week (2,080 hours/year): $93,600 ÷ 2,080 = $45.00/hr — this is the BLS median converted directly.
- Three 12-hour shifts per week (36 hours/week, 1,872 hours/year): $93,600 ÷ 1,872 = $50.00/hr — the same annual salary yields a higher hourly rate because fewer hours are worked.
- Full-time with 4 hours/week average overtime (2,288 hours/year): $93,600 ÷ 2,288 = $40.91/hr base, but overtime hours are paid at 1.5x, so the effective blended rate rises above $45.00/hr.
The 36-hour schedule is standard in hospital nursing, which means the BLS annual figure actually converts to a higher hourly rate than the headline $45.00 when you use actual scheduled hours rather than the 2,080 assumption. A nurse earning $93,600 on a 36-hour schedule is effectively earning $50.00/hr for hours worked.
Benefits add another layer. Employer-paid health insurance, retirement contributions, and paid time off have real dollar value. A benefits package worth $15,000/year on a $93,600 salary raises total compensation to $108,600, which converts to roughly $58.00/hr of total value on a 1,872-hour schedule.
Overtime, shift differentials, and what total compensation really looks like
Base hourly rate is the starting point, not the finish line. For many nurses, overtime and differentials add 10–25% to annual earnings.
- Federal overtime rules: Under the Fair Labor Standards Act, non-exempt employees earn 1.5x their regular rate for hours worked beyond 40 in a workweek. Check DOL guidance and your state labor office for any state-specific rules that are more generous.
Pro Tip: To compare two job offers on equal footing, build a simple spreadsheet: base hourly rate × expected annual hours + (overtime hours × 1.5 × base rate) + shift differential value + benefits dollar value. Two offers with the same base rate can differ by $10,000+ per year once you account for schedule, differentials, and benefits.
What does the job outlook mean for RN wages?
The BLS projects registered nurse employment to grow 6% through 2033, faster than the average for all occupations. That demand signal matters for wages: when facilities compete for nurses, base rates and sign-on packages rise.
Several forces are pushing RN wages upward in the near term:
- Aging population: — The 65+ demographic is the fastest-growing segment of healthcare consumers, increasing demand for hospital, home health, and long-term care nursing.
The BLS May 2024 data puts the median RN annual wage at $93,600, up from earlier survey periods, reflecting sustained upward pressure on base rates.
Where do these numbers come from?
The figures in this article draw from three primary sources, each with a different methodology:
- BLS Occupational Employment and Wage Statistics (OES): — The federal benchmark. Surveys approximately 1.1 million establishments semi-annually; May 2024 data is the most recent annual release. Covers base wages only, not bonuses or overtime.
- Indeed: — Job-posting aggregator with 250,000+ RN salary data points updated through June 2026. Reflects advertised wages, which tend to run slightly higher than what incumbents report.
- Salary Atlas: Compiles BLS/OES data and refreshes figures annually. The Salary Atlas methodology page explains sourcing and update cadence in detail.
When sources disagree, the BLS figure is the most statistically rigorous because of its sample size and standardized methodology. Aggregator figures are useful for understanding the current job market and advertised rates. Data in this article reflects BLS OES May 2024 and aggregator figures current as of mid-2026. Figures are updated annually; check primary sources for the most current release.
How to use this data when evaluating or negotiating an offer
The numbers above are most useful when you apply them to a specific situation. Here is a practical checklist:
- Compare the offered hourly rate to the BLS median for your state, not the national median.
- Adjust for cost of living if you are comparing offers across states.
- Calculate the shift differential value and add it to the base rate before comparing.
- Confirm whether overtime is guaranteed, voluntary, or mandatory.
- Verify the benefits package value (health insurance, retirement match, PTO).
- Check whether the position is exempt or non-exempt under FLSA.
Questions to ask a recruiter or hiring manager:
- What is the base hourly rate for this position, and what is the pay scale for my experience level?
- What shift differentials apply, and are they guaranteed or discretionary?
- Is overtime mandatory? What is the average weekly overtime for this unit?
- What is the sign-on bonus, and what are the repayment terms?
- How often are merit increases reviewed, and what is the typical annual raise?
- What is the total benefits package value, including retirement match and health insurance?
During a negotiation, document comparable pay by pulling state-level percentile data from the Salary Atlas RN salary page and BLS state tables. Presenting a specific percentile benchmark ("the 75th percentile for RNs in this state is $X/hr") is more persuasive than citing a national average.
The numbers tell you where you stand — what you do with them is the real work
Most nurses I see underprepared for salary negotiations aren't lacking ambition. They're lacking specifics. They know they want more, but they walk into a conversation without a percentile, a state benchmark, or a clear calculation of what their shift differential is actually worth annually.
The data in this article is a starting point, not a verdict. The BLS median of $45.00/hr is a useful anchor, but it flattens enormous variation. A new grad in rural Alabama and a 15-year ICU nurse in San Francisco are both "registered nurses" in the BLS dataset. The median doesn't speak to either of them directly.
What actually matters is knowing your specific market: your state's 75th percentile, your specialty's premium, and the dollar value of the shift differential you're being offered. Those three numbers, combined, give you a defensible position in any negotiation. The nurses who use them walk out of offer conversations with better outcomes than those who cite a national average and hope for the best.
Transparency in wage data isn't just a nice feature. It's the difference between accepting a below-market offer because you didn't know better and walking away with $5,000 more per year because you did.
Salary Atlas gives you the state and percentile data to negotiate with confidence
Knowing the national median is useful. Knowing the 75th percentile for RNs in your specific state is what actually moves a negotiation.
Salary Atlas publishes free, BLS-sourced RN wage data with no paywall, no signup, and no fabricated figures. Every number links back to its primary source. The registered nurse salary page gives you median, percentile, and trend data in one place, and the salary-by-state tool lets you pull the exact state benchmark you need before your next interview. Figures are refreshed annually from BLS OES releases. Pull your state's 75th percentile, calculate your shift differential value, and walk into your next offer conversation with a number, not a guess.
Useful sources
These are the primary sources for the figures in this article, along with what each one contains and how often it updates:
- Registered nurse salary in United States (Updated 2026)
- Nurse Salary by State: How Much do Nurses Make in 2026? | Nurse.Org
- How much does a Registered Nurse make? | Glassdoor
- Methodology — Salary Atlas
- dol.gov
Salary Atlas refreshes its RN data annually from BLS OES releases. The BLS itself publishes new OES figures each May, covering the prior calendar year's survey period.
FAQ
How much are U.S. nurses paid per hour?
The BLS median for registered nurses is approximately $45.00/hr as of May 2024, with a typical range from about $30/hr at the entry level to $66.81/hr or more at the 90th percentile.
Do nurses make $70 an hour?
Most staff RNs generally do not reach $66.81/hr, but higher rates are achievable in high-paying states like California, in high-demand specialties, or through travel nursing packages that combine base pay and tax-free stipends.
What nurse makes $100 an hour?
Certified Registered Nurse Anesthetists (CRNAs) regularly earn at or above $100/hr. The BLS puts CRNA median annual pay above $200,000, which converts to roughly $96/hr or more on a standard full-time schedule.
How much does a nurse with two years of experience make?
A nurse with roughly two years of experience typically earns near the 25th percentile, around $36/hr nationally, though state and specialty can push that figure meaningfully higher or lower.
Why do salary sites show different hourly rates for nurses?
Methodology drives the gap. Job-posting aggregators like Indeed capture advertised wages (which skew higher), while self-reported platforms like PayScale reflect what nurses currently earn. The BLS figure is the most statistically rigorous because it surveys over a million employers directly.