29.5% = ~$20,650: Calculate Your U.S. Employee Benefits Value

Benefits typically add about 29.5% on top of a private-sector worker's wages, according to BLS. For a $70,000 salary, that translates to roughly $20,650 in employer-paid benefits, most of it hidden in health insurance, retirement matching, and paid time off. The KFF Employer Health Benefits Survey and BLS's Employer Costs for Employee Compensation report anchor this figure.
*TL;DR:>
- Employee benefits generally add around 29.5% to private-sector wages, which translates to roughly $20,650 annually for a $70,000 salary.*
- Health insurance costs, mainly covered by employers averaging $20,143 for family plans, dominate the total value of benefits packages.
- Retirement matching averages about 4.7% of salary, and its value depends heavily on vesting schedules and multi-year contributions.
- Comparing benefits effectively requires detailed calculations of employer contributions, PTO, vesting, and perks, rather than relying on vague percentages or impressions.
Table of Contents
- The Value of Employee Benefits: A Quick Snapshot
- What Makes Up the Value of a Benefits Package
- How to Calculate the Dollar Value of Your Benefits Package
- Employer Benchmarks: Budgeting for a Benefits Load
- Using Benefits Value in Negotiations and Budgeting
- Tax Treatment of Employee Benefits: What Actually Changes
- Benefits Value Differs by Employment Type
- Valuing Benefits That Don't Come With a Price Tag
- What People Get Wrong About Benefits Value
- Run Your Own Numbers With Salary Atlas
- Sources
- FAQ
The Value of Employee Benefits: A Quick Snapshot
The BLS Employer Costs for Employee Compensation report is the closest thing the U.S. labor market has to an official scoreboard for this question. Its most recent breakdown puts wages at about $31.47 an hour and benefits at $13.20 an hour for private industry workers, which works out to benefits equaling roughly 29.5% of total compensation. For example, a $70,000 salary would have benefits adding a substantial extra value rather than paycheck dollars.
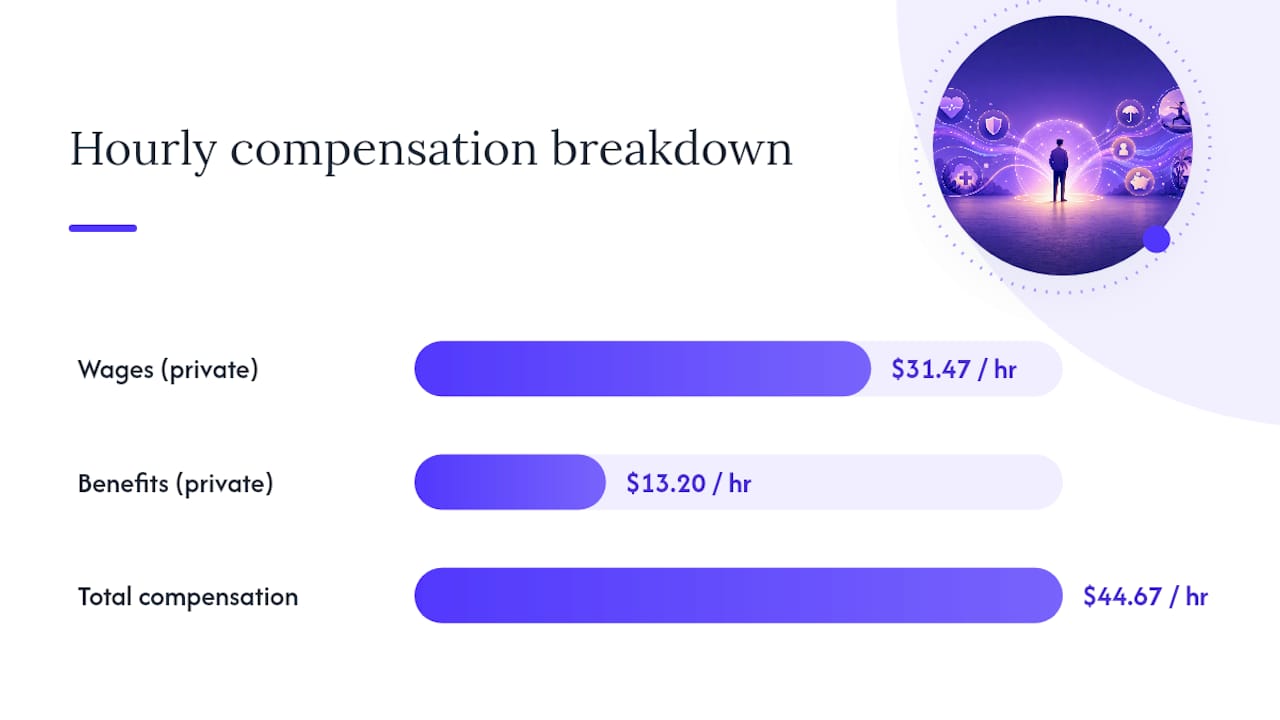
Health insurance drives most of that number by itself. KFF's most recent employer survey found the average family health plan costs $26,993 a year in total premiums, with employers covering about $20,143 of it, or roughly 74% of the total premium. Single coverage runs cheaper, with total premiums near $9,325 and employers paying about $7,885. That single line item can eat up more of a benefits package's dollar value than retirement, PTO, and perks combined.
Two job offers, same salary, very different math. Say two companies both offer $75,000. Company A's package is worth several thousand dollars more per year before either employee touches a paycheck, purely on health and retirement contributions.The 25 to 40 percent rule of thumb: Most practical benchmarks used by HR and compensation teams put total benefits value somewhere between 25% and 40% of base salary, with 30% as a common working average. The BLS figure of 29.5% sits right in that band, which is why it holds up as the go-to reference point.
The gap between a "good" benefits package and a mediocre one rarely shows up in the base salary line. It shows up in the fine print of what the employer covers before tax and what the employee has to cover after.
What Makes Up the Value of a Benefits Package
Total compensation breaks into a handful of categories, and each one behaves differently when you try to put a number on it. Some are contractual and easy to calculate. Others depend on assumptions you have to make yourself.
- Health insurance. This is usually the single biggest line item. Employer contributions for family coverage average around $20,143 a year, and single coverage averages about $7,885, per KFF's 2025 survey. The employer share, not the sticker price of the plan, is what belongs in your calculation.
- Retirement matching. The average maximum employer 401(k) match sits near 4.7% of salary, often structured as dollar for dollar on the first 3% and 50 cents on the dollar for the next 2%, based on figures compiled by Salario. On a $75,000 salary, a 4.7% match is worth about $3,525 a year, but only if you stay long enough to vest.
- Paid time off. PTO has a real dollar value equal to your daily rate times the number of days. At a $75,000 salary, each PTO day is worth about $288, so 20 days comes out to roughly $5,769, according to Salario's breakdown.
- Employer-side payroll taxes. Employers pay legally required payroll taxes such as Social Security and Medicare contributions, with rates and wage bases published annually by the Social Security Administration.
- Life and disability insurance. Employer-paid basic life insurance and short-term disability coverage tend to run in the low hundreds of dollars annually per employee, though long-term disability and supplemental life coverage can push that higher depending on the plan.
- Perks and stipends. Wellness stipends, commuter benefits, student loan assistance, and tuition reimbursement are smaller individually, often a few hundred to a couple thousand dollars a year, but they add up and they're easy to overlook when comparing two offers side by side.
None of these numbers are fixed. They swing based on firm size (larger employers generally negotiate better group health rates and richer 401(k) matches), industry (finance and tech tend to offer richer packages than retail or hospitality), and union status (unionized workplaces often carry contractually guaranteed benefit floors that nonunion employers don't match). A 50-person startup and a 5,000-person insurance company can both call their health plan "generous" and mean two very different dollar amounts.
Retirement matches come with a catch
Vesting schedules quietly change what a match is actually worth to you. A 4%%20Vesting%20Schedules%E2%80%94in%20Numbers%20_%20Yale%20Law%20Journal.pdf) match sounds identical whether it vests immediately or over four years, but if you leave after 18 months and the plan uses a four-year vesting schedule, you might walk away with only a quarter of what was technically "yours." Compensation writer Stephen B. Dunbar III advises evaluating retirement benefits on a multi-year horizon rather than a single annual snapshot, precisely because vesting and compounding can create large differences that don't show up if you only look at year one.
Paid time off isn't always what it looks like
Unlimited PTO policies sound like the best possible perk until you look at what people actually use. Research reported by SHRM found that employees with unlimited PTO typically take only 12 to 16 days off per year, often fewer than they'd take under a traditional accrual policy with a guaranteed 20 or 25 days. If you're comparing an "unlimited" policy against a fixed 20-day policy, the fixed policy may carry more realized dollar value, not less. Carry-over rules, payout-on-termination policies, and state-mandated sick leave laws also affect what PTO is worth in practice, and those rules vary enough by state that it's worth checking your specific offer rather than assuming a national average applies.
How to Calculate the Dollar Value of Your Benefits Package
You don't need a finance degree to run this math. You need your offer letter, a calculator, and about ten minutes.
- Start with base salary. This is your anchor number. Everything else gets added on top of it.
- Add the employer's health insurance contribution. Ask HR for the exact dollar amount they pay toward your premium, not the total premium. If they won't give you a number, use the KFF averages of about $20,143 for family coverage or $7,885 for single coverage as a placeholder.
- Calculate the retirement match value. Multiply your salary by the match percentage. A 4% match on $80,000 is $3,200 a year, assuming you contribute enough to capture the full match.
- Value your PTO. Divide your salary by roughly 260 working days a year to get a daily rate, then multiply by your PTO days. At $80,000, that's about $308 a day.
- Note employer payroll tax contributions. These aren't paid to you directly, but they're a real cost the employer absorbs on your behalf, typically 7.65% of wages for Social Security and Medicare combined, plus unemployment insurance.
- Add fixed perks. Commuter subsidies, wellness stipends, and tuition assistance usually have a stated annual cap. Use the actual number from the benefits guide, not a guess.
- Estimate equity conservatively, if offered. Don't use grant face value. Apply a multi-year vesting schedule and a conservative appreciation assumption, since unvested equity is a promise, not cash in hand.
Pro Tip: Ask for a total rewards statement before you accept an offer. Many employers can generate one on request, and it turns a vague "great benefits" pitch into an itemized dollar figure you can actually compare.
Here's how that math plays out across two competing offers, both at $80,000 base salary:
Same base salary, nearly a $13,000 difference in real annual value. That's the entire point of running the numbers instead of trusting the phrase "competitive benefits" on a job posting.
A simple version of the formula, if you want to build your own spreadsheet:
Total Compensation = Base Salary + Employer Health Contribution + (Salary × Retirement Match %) + (Daily Rate × PTO Days) + Fixed PerksEmployer Benchmarks: Budgeting for a Benefits Load
Employers use the term "benefits load" to describe total benefits spending as a percentage of payroll.
Three rough tiers show up consistently in compensation planning:
- Lean scenario (roughly 20 to 25% of salary): Minimal health contribution, no retirement match, statutory PTO only. Common among small businesses and some hospitality or retail employers working with tight margins.
- Standard scenario (roughly 28 to 32% of salary): Solid health coverage share, a modest 401(k) match around 3 to 4%, and 15 to 20 PTO days. This is where most mid-sized private employers land, consistent with the BLS national average.
- Rich scenario (roughly 38 to 45% of salary): Strong health coverage, matches above 5%, generous PTO, and added perks like tuition assistance or wellness stipends. Typically seen at larger firms, unionized workplaces, and competitive tech or finance employers.
Firm size and industry drive most of the variation here. Larger employers spread fixed administrative costs across more employees, which lets them negotiate better group insurance rates and offer richer matches at a lower marginal cost per person. HR and finance teams tracking benefits load should watch it alongside turnover data. A wellness-focused ROI analysis makes the case that health-related investments often pay for themselves through lower absenteeism and turnover, which matters when you're deciding whether a lean package is actually saving money or just deferring a bigger cost.
Using Benefits Value in Negotiations and Budgeting
Once you have a dollar figure, it becomes a negotiating tool instead of a vague talking point. Salario's research found that presenting benefits as a specific dollar amount, and ideally a per-paycheck equivalent, is far more persuasive in negotiations than describing them in percentages alone. "That match is worth about $270 per paycheck" sticks.
Before accepting or negotiating any offer, run through this checklist:
- What percentage of the health premium does the employer actually pay, and what's your deductible and out-of-pocket maximum?
- How many PTO days do you get, and is unused time paid out if you leave?
- What's the 401(k) match formula, and how long is the vesting schedule?
- Is there paid parental or family leave beyond what state law requires?
- Are commuter benefits, childcare assistance, or tuition reimbursement included, and what are the annual caps?
If the base salary is fixed but you want more, ask about the levers that move independently of salary. A script that works: "I understand the salary band is fixed. Would there be flexibility on the health premium contribution, a signing bonus, or an accelerated PTO accrual instead?" That reframes the conversation around dollars the employer can move without touching the salary line they've already committed to internally. Pro Tip: If a recruiter can't answer specifics about the health premium split or vesting schedule on the spot, ask for it in writing before you sign anything. Verbal promises about benefits rarely survive a change in HR staff.
For employers, the retention question isn't just "how much do we spend" but "where does that spending actually change behavior." A Kiplinger analysis found that employers routinely under-communicate the dollar value of what they already offer, and that a clear total-rewards statement measurably improves retention and perceived fairness, sometimes more cheaply than adding new perks would.
Tax Treatment of Employee Benefits: What Actually Changes
Most employer-paid benefits carry a tax advantage that raw salary doesn't, and that's a big part of why they're worth including in any real compensation comparison. Employer contributions to health insurance premiums are generally excluded from an employee's taxable income, meaning a $15,000 health contribution doesn't show up as $15,000 of extra taxable wages on your W-2. Traditional 401(k) contributions work similarly on the employee side: pre-tax contributions reduce taxable income now, with taxes deferred until withdrawal in retirement.
Employers get their own tax treatment to consider. Contributions to qualified retirement plans and premiums paid for group health coverage are typically deductible as business expenses, and the Social Security Administration outlines how employer-side Social Security and Medicare contributions function as a mandatory cost separate from what's withheld from employee paychecks.
Not every benefit gets the same treatment. Cash bonuses, most stipends, and the taxable portion of certain fringe benefits get added to gross income and taxed like regular wages. Dependent care assistance and commuter benefits often have specific pre-tax limits set by the IRS, and exceeding those caps can trigger taxable income on the overage. This is exactly why a $2,000 pre-tax commuter benefit and a $2,000 taxable spot bonus aren't equal in take-home value, even though they look identical on paper. When comparing two offers, checking which perks are pre-tax and which are taxable can shift the real dollar comparison more than people expect.
Benefits Value Differs by Employment Type
Full-time, part-time, and contract workers experience the value of employee benefits very differently, and this is one of the most overlooked pieces of the puzzle. Full-time employees are the primary beneficiaries of the BLS and KFF benchmarks cited throughout this article, since most employer-sponsored health plans and retirement matches require a minimum hours threshold, typically 30 hours a week under Affordable Care Act employer mandate rules, to qualify.
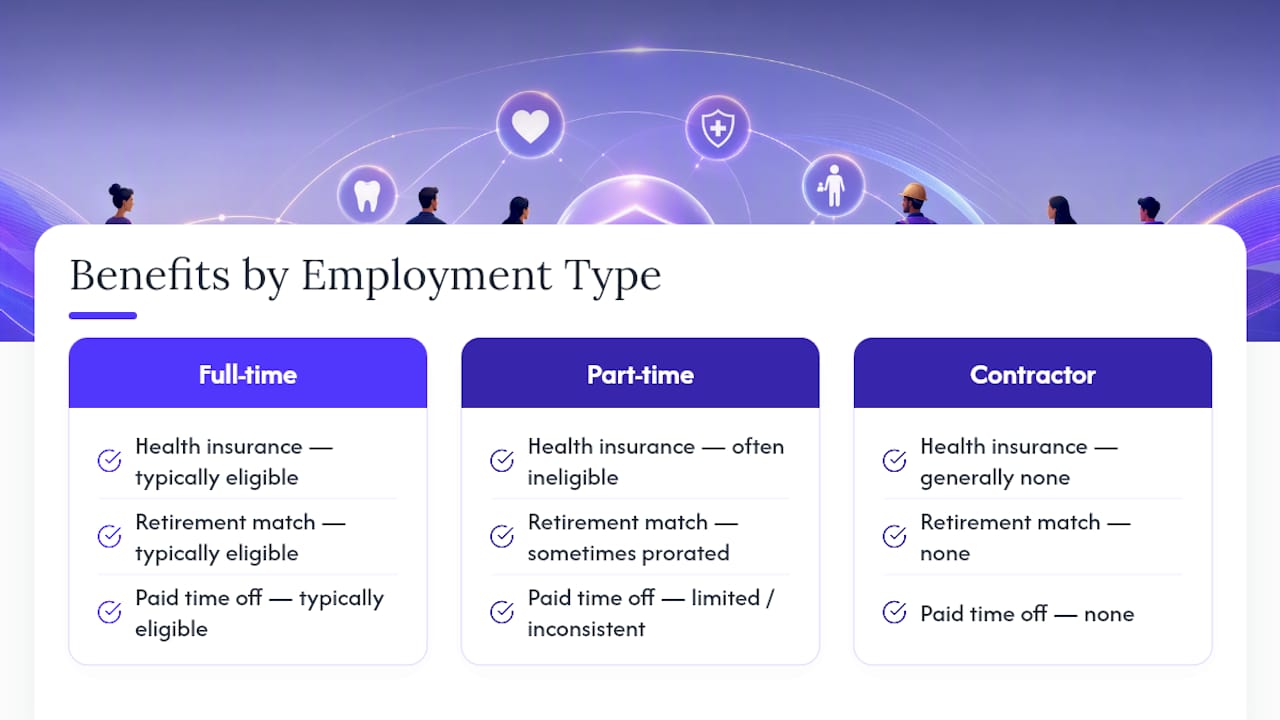
Part-time employees frequently fall outside that threshold entirely. Some employers do offer prorated retirement matches or limited PTO to part-time staff, but it's inconsistent enough that part-time workers should confirm eligibility rules directly rather than assume standard benchmarks apply.
Contract and freelance workers are in the most different position of all. Independent contractors classified under a 1099 arrangement typically receive no employer-paid health insurance, no retirement match, and no PTO, because they aren't legally employees.
Valuing Benefits That Don't Come With a Price Tag
Not every valuable benefit shows up on a total-rewards statement with a dollar sign next to it. Flexible work hours, remote work options, and professional development budgets carry real value, but they resist the clean percentage-of-salary math used for health insurance or retirement matching.
One practical way to value flexible scheduling or remote work is to price out what you'd otherwise spend to replicate it, commuting costs, work clothes, parking, or the childcare hours a flexible schedule lets you avoid paying for. For someone with a 45-minute commute each way, remote or hybrid work can realistically save several thousand dollars a year in gas, transit fares, and time that has its own opportunity cost.
Professional development budgets are easier to price directly. If an employer offers $2,000 a year toward courses, certifications, or conference attendance, that's a stated dollar figure you can add straight into your total compensation math, the same way you'd treat a tuition reimbursement stipend.
Other non-monetary benefits, like a genuinely supportive management style, predictable workloads, or a strong learning culture, don't reduce to dollars at all, and pretending otherwise produces a false sense of precision. The honest approach is to price what's priceable, whether it's a stipend, an hours-based estimate, or an avoided cost, and treat the rest as a qualitative factor you weigh separately when comparing offers rather than forcing it into a spreadsheet cell it doesn't belong in.
What People Get Wrong About Benefits Value
The biggest mistake I see people make is treating "unlimited PTO" as automatically superior to a fixed policy. It sounds generous. In practice, the data on realized usage tells a different story, and a guaranteed 20 days often beats an unlimited policy that quietly discourages people from taking more than 12 or 13 days a year.
The second mistake is looking at health insurance only through the premium contribution and ignoring deductibles, copays, and out-of-pocket maximums. A plan with a lower employer premium share but a $1,500 deductible can cost you less overall than a plan with a higher premium share but a $6,000 deductible, depending on how much health care you actually use in a given year.
The third mistake is evaluating a retirement match as if you're only ever going to work there one year. Vesting schedules and compounding change the math substantially over three or four years, which is exactly why Kiplinger's compensation guidance pushes readers toward a multi-year lens rather than a single annual snapshot.
If you take one action away from this, request a total rewards statement from your current or prospective employer and run the calculation yourself using a three-year horizon instead of one. The numbers rarely match the gut feeling you had reading the offer letter.
— Joelen Zyoktova
Run Your Own Numbers With Salary Atlas
Comparing two job offers by feel gets you nowhere. What actually moves the decision is a real number, built from BLS wage data instead of a recruiter's talking points, and that's the specific gap Salary Atlas fills for free with no signup wall in the way.
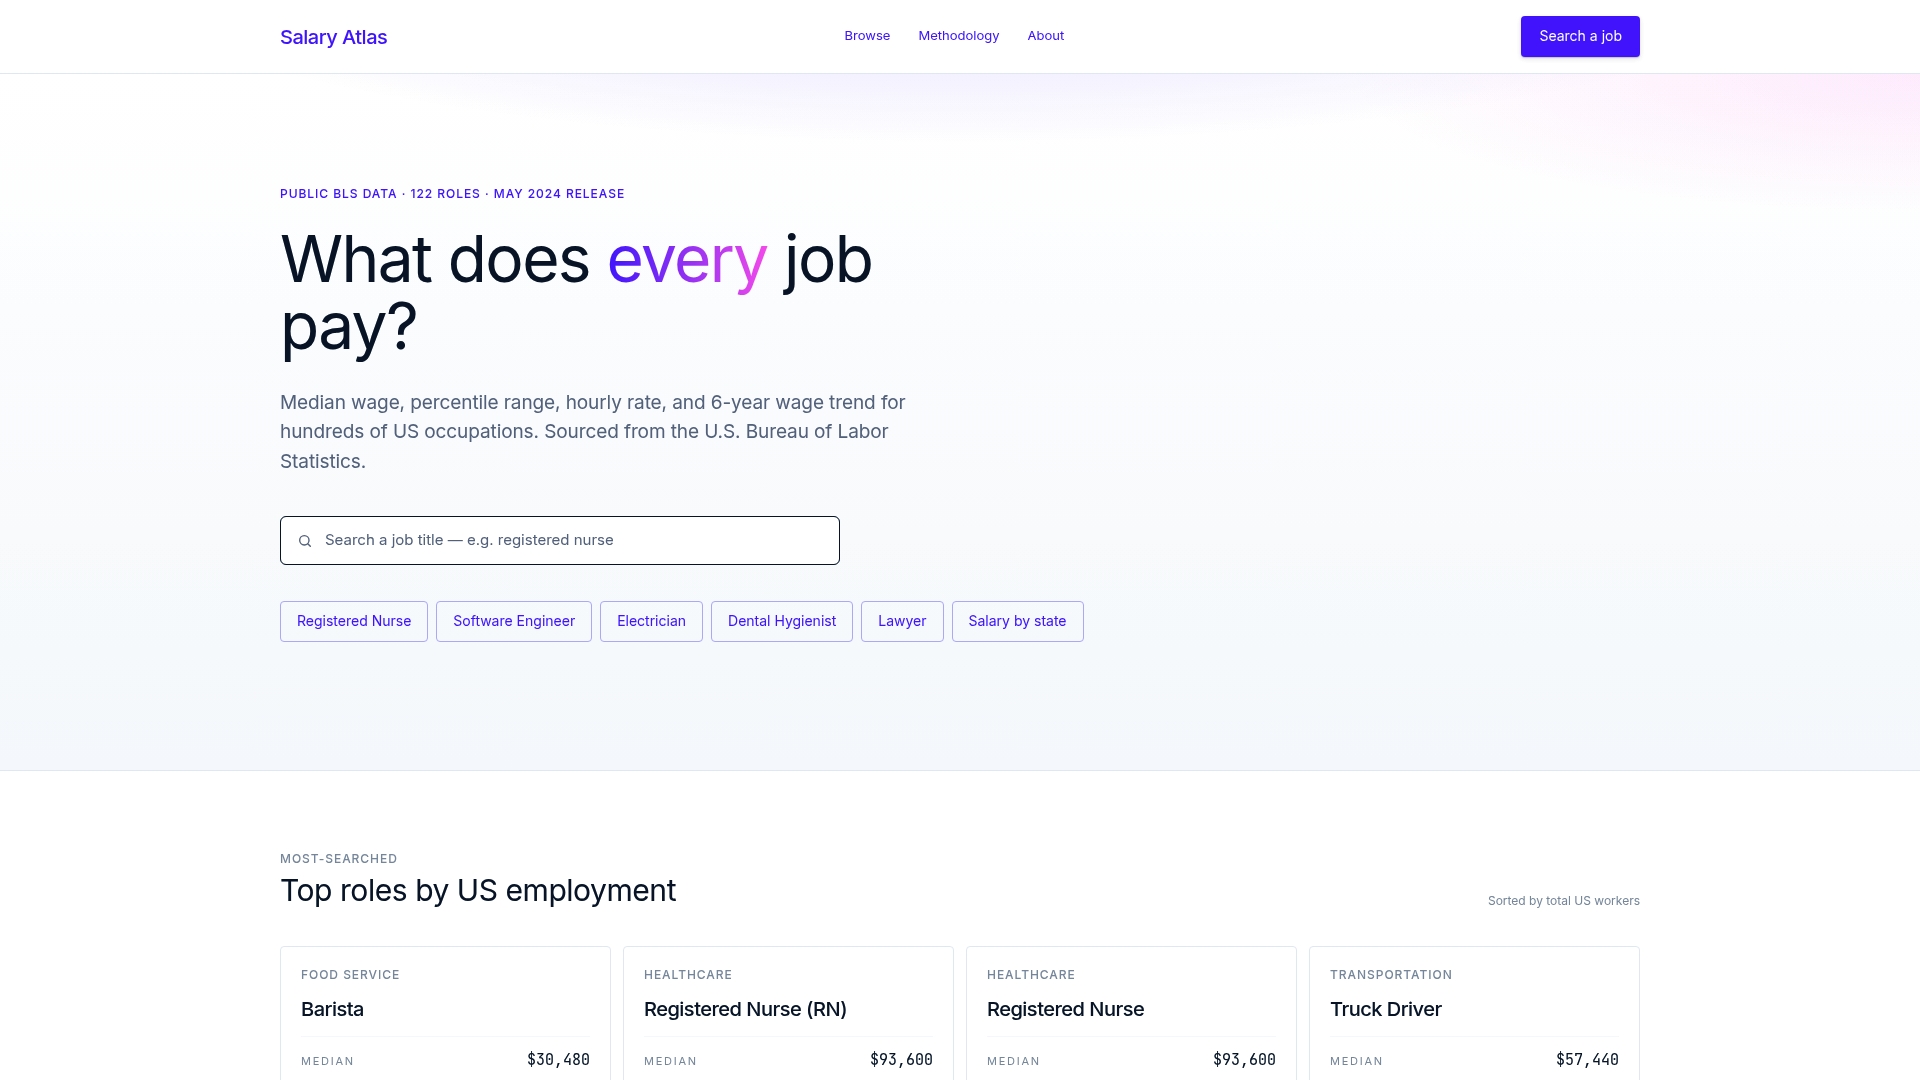
Every salary figure on the referenced salary data platforms links back to its BLS source, so users can check the underlying government data themselves rather than trust a number that showed up in a job posting. If you're weighing a new offer against your current pay, start with Salary Atlas's state-by-state wage data to see how your base salary compares to the local market before you even factor in benefits. Curious how the methodology behind those figures actually works? The Salary Atlas methodology page breaks down exactly how BLS statistics turn into the numbers published on every job page across the site. Pull up your target occupation, check the real market range, and use that as your baseline the next time a recruiter tells you an offer is "competitive."
Sources
Salary Atlas builds its salary figures directly from BLS Occupational Employment and Wage Statistics and the Employer Costs for Employee Compensation dataset, the same government sources cited throughout this article. Every wage figure links back to its original BLS release, so readers can verify a number instead of taking a website's word for it.
That sourcing discipline matters most when you're trying to sanity-check a job offer against a real market benchmark rather than a recruiter's claim about what's "competitive."
FAQ
What is the value of employee benefits?
Employee benefits typically add about 29.5% on top of base wages for private industry workers, based on BLS Employer Costs for Employee Compensation data. For a $70,000 salary, that's roughly $20,650 a year in employer-paid health insurance, retirement contributions, paid time off, and other benefits.
What are the top benefits employees actually want?
Health insurance, retirement matching, and paid time off consistently rank as the most sought-after benefits, since they carry the largest and most predictable dollar value compared to smaller perks like stipends or wellness programs.
What are the seven employee benefits?
Definitions vary across employers, but a common grouping includes health insurance, retirement plans, paid time off, life and disability insurance, employer payroll tax contributions, flexible work arrangements, and professional development or tuition assistance.
How do I calculate the dollar value of my benefits package?
Add up the employer's health insurance contribution, the retirement match in dollars, the value of your PTO days at your daily pay rate, and any fixed perks like commuter or wellness stipends, then layer that total on top of your base salary. Tools like the Salario calculator walk through this line by line if you want a template.
Why does health insurance dominate benefits value so much?
Employer health contributions average about $20,143 a year for family coverage under KFF's 2025 survey, which is often larger than every other benefit category combined, making it the single biggest driver of differences between two job offers.