Tens of Thousands at Stake: BLS Linked U.S. Software Engineer Salaries
Use BLS sourced medians and cost adjusted checks to compare U.S. software engineer pay, spot metro gaps, and craft a data backed offer.
By the Salary Atlas editorial team · Published

In nominal dollars, California, Washington, New York, Massachusetts, and Maryland pay software engineers the most, with state medians running well above the national figure. That ranking flips fast once you factor in housing costs, state income tax, and the fact that remote work now lets companies pay by location instead of by headquarters address. The number on the offer letter and the number in your bank account after rent are two very different stories.
TL;DR:
- Adjusted for cost of living and taxes, salaries in lower-cost states like Texas and Illinois can be more competitive than their nominal rankings suggest.
- Remote work allows engineers to retain higher pay levels when moving from high-paying cities to regions with a national or role-based pay structure.
- When negotiating, job seekers should focus on percentiles and use metro-specific data, not statewide averages, to ensure accurate salary expectations.
- State-level salary figures from the BLS are refreshed annually and should be cross-checked with metro data and current job postings for precise budgeting.
- For remote teams, understanding the company's pay band approach is crucial to avoid overpaying in some areas or undercompensating in high-cost markets.
Table of Contents
- Software Engineer Salary by State: Top 10 and the National Median
- How to Compare State Salaries Correctly
- How Remote Work Has Changed Salary Comparisons
- Turning State Data Into an Actual Offer or Budget
- Where These Salary Figures Actually Come From
- Why Salary Atlas Builds State Pages This Way
- Get the Full State-by-State Breakdown
- Sources
- FAQ
Software Engineer Salary by State: Top 10 and the National Median
The gap between the top-paying states and the national median is bigger than most job seekers expect. California, Washington, New York, Massachusetts, and Maryland consistently sit at the top of state-by-state rankings for software engineering pay, and the spread between them and states in the middle of the pack can run into tens of thousands of dollars a year.
For national context, U.S. News Careers puts software developer pay well above the median wage for all occupations, and state medians can differ from that baseline by a wide margin depending on tech industry concentration. California's median is known to be higher than the national figure, driven by the density of large tech employers headquartered there.
Here's a snapshot of where the pay tends to land, ranked by relative position to the national median rather than exact dollar figures, since state-level numbers shift with each data refresh:
| Rank | State | Position vs. national median |
|---|---|---|
| 1 | California | Well above |
| 2 | Washington | Well above |
| 3 | New York | Well above |
| 4 | Massachusetts | Above |
| , | Maryland | Above |
| , | Virginia | Above |
| , | Colorado | Above |
| , | Texas | Near |
| , | New Jersey | Near |
| 10 | Illinois | Near |
- The top five states cluster around major tech hubs (the Bay Area, Seattle, New York City, Boston, and the DC/Baltimore corridor), not statewide averages.
- Texas and Illinois land near the national median because their tech pay is heavily concentrated in specific metros (Austin, Chicago) rather than spread evenly across the state.
- A handful of lower-cost states post surprisingly strong numbers when adjusted for purchasing power, even though their nominal figures don't crack the top ten.
How to Compare State Salaries Correctly
Nominal salary tells you what shows up on the offer letter. Cost-adjusted salary tells you what that number can actually buy once rent, groceries, and state taxes take their cut. Purchasing power comparisons that skip this step routinely mislead both job seekers and the hiring managers setting their budgets, because a $140,000 salary in Austin and a $140,000 salary in San Francisco are not remotely equivalent offers.
Median is the better number to anchor on here, not mean, because a small number of extremely high earners at senior levels can pull an average up without reflecting what a typical engineer actually makes.
To adjust a nominal figure into something usable for a relocation or job-offer decision, run through this quick process:
- Pull the state or metro median salary for the role and experience level you're targeting.
- Check a cost-of-living index (housing weighs heaviest, so look at rent or home price data specifically) for both locations.
- Subtract the estimated state income tax difference, since some states (Texas, Washington, Florida) charge none while others (California, New York) take a meaningful cut.
- Recalculate the take-home comparison, not the gross comparison, before deciding a move or offer is actually a raise.
How Remote Work Has Changed Salary Comparisons
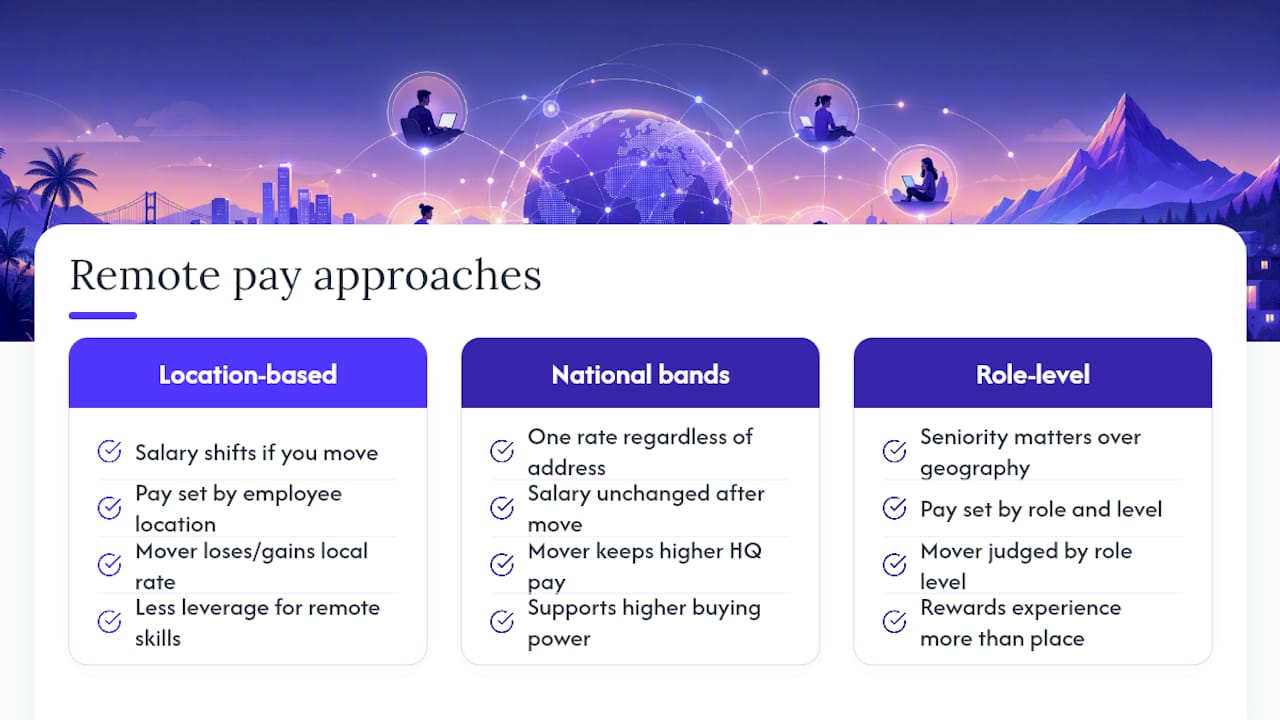
Remote hiring broke the old assumption that pay follows headquarters location. Employers now generally take one of three approaches: location-based pay bands (your salary shifts if you move), national bands (one rate regardless of address), or role-level differentiation where seniority matters more than geography. Remote employees with rare or in-demand skills are increasingly negotiating pay above what their location would otherwise suggest, especially when they can point to competing offers.
Say an engineer moves from San Francisco to Boise while keeping a company that uses national pay bands. They keep the higher salary and gain enormous purchasing power. Ask about the band structure before you sign a lease.
Turning State Data Into an Actual Offer or Budget
State figures are only useful once you translate them into a specific ask or a specific budget line. The process looks different depending on which side of the table you're sitting on.
For job seekers:- Pick a target percentile (50th is typical, 75th if you have specialized skills) rather than just the median.
- Gather three to five comparable listings in your target state or metro to back up your number.
- Present the cost-adjusted figure, not the raw state median, when negotiating a relocation or remote offer.
- Build location-based pay bands using metro data, not statewide averages, to avoid overpaying in lower-cost areas or losing candidates in expensive ones.
- Check internal equity before setting a new band. A new hire's offer shouldn't dramatically outpace existing engineers in the same role and metro.
- Document percentile targets per role level so raises and promotions stay consistent across the team.
Where These Salary Figures Actually Come From
Every figure in this article traces back to the U.S. Bureau of Labor Statistics Occupational Employment and Wage Statistics (OEWS) program, which is sourced directly and refreshed annually rather than recycling old numbers indefinitely.
A few definitions matter here. Median is the middle value in the pay distribution, meaning half of engineers earn more and half earn less. Mean is the mathematical average, which top earners can skew upward. Percentiles (25th, 75th, 90th) show where a specific salary falls relative to the broader range, which is far more useful than a single median when you're negotiating a specific offer.
Limitations worth knowing:
- Statewide figures hide metro-level gaps, sometimes by tens of thousands of dollars.
- BLS data has a reporting lag, so current job postings may run ahead of published figures.
- Sample sizes vary by state, and smaller states carry wider margins of error.
Why Salary Atlas Builds State Pages This Way
Salary Atlas ties every state figure back to its BLS source and refreshes the data annually instead of letting stale numbers sit indefinitely. That transparency matters more than any single ranking, because a number without a source is just a claim.
Pair Salary Atlas's state data with a handful of current job postings in your target metro. The combination gives you both the statistical baseline and the on-the-ground reality of what companies are actually offering right now.
, Joelen Zyoktova
Get the Full State-by-State Breakdown
This platform provides an alternative to piecing together salary estimates from scattered blog posts and paywalled salary tools. Every figure on the state salary pages links directly back to its BLS OEWS source, helping users verify their numbers.
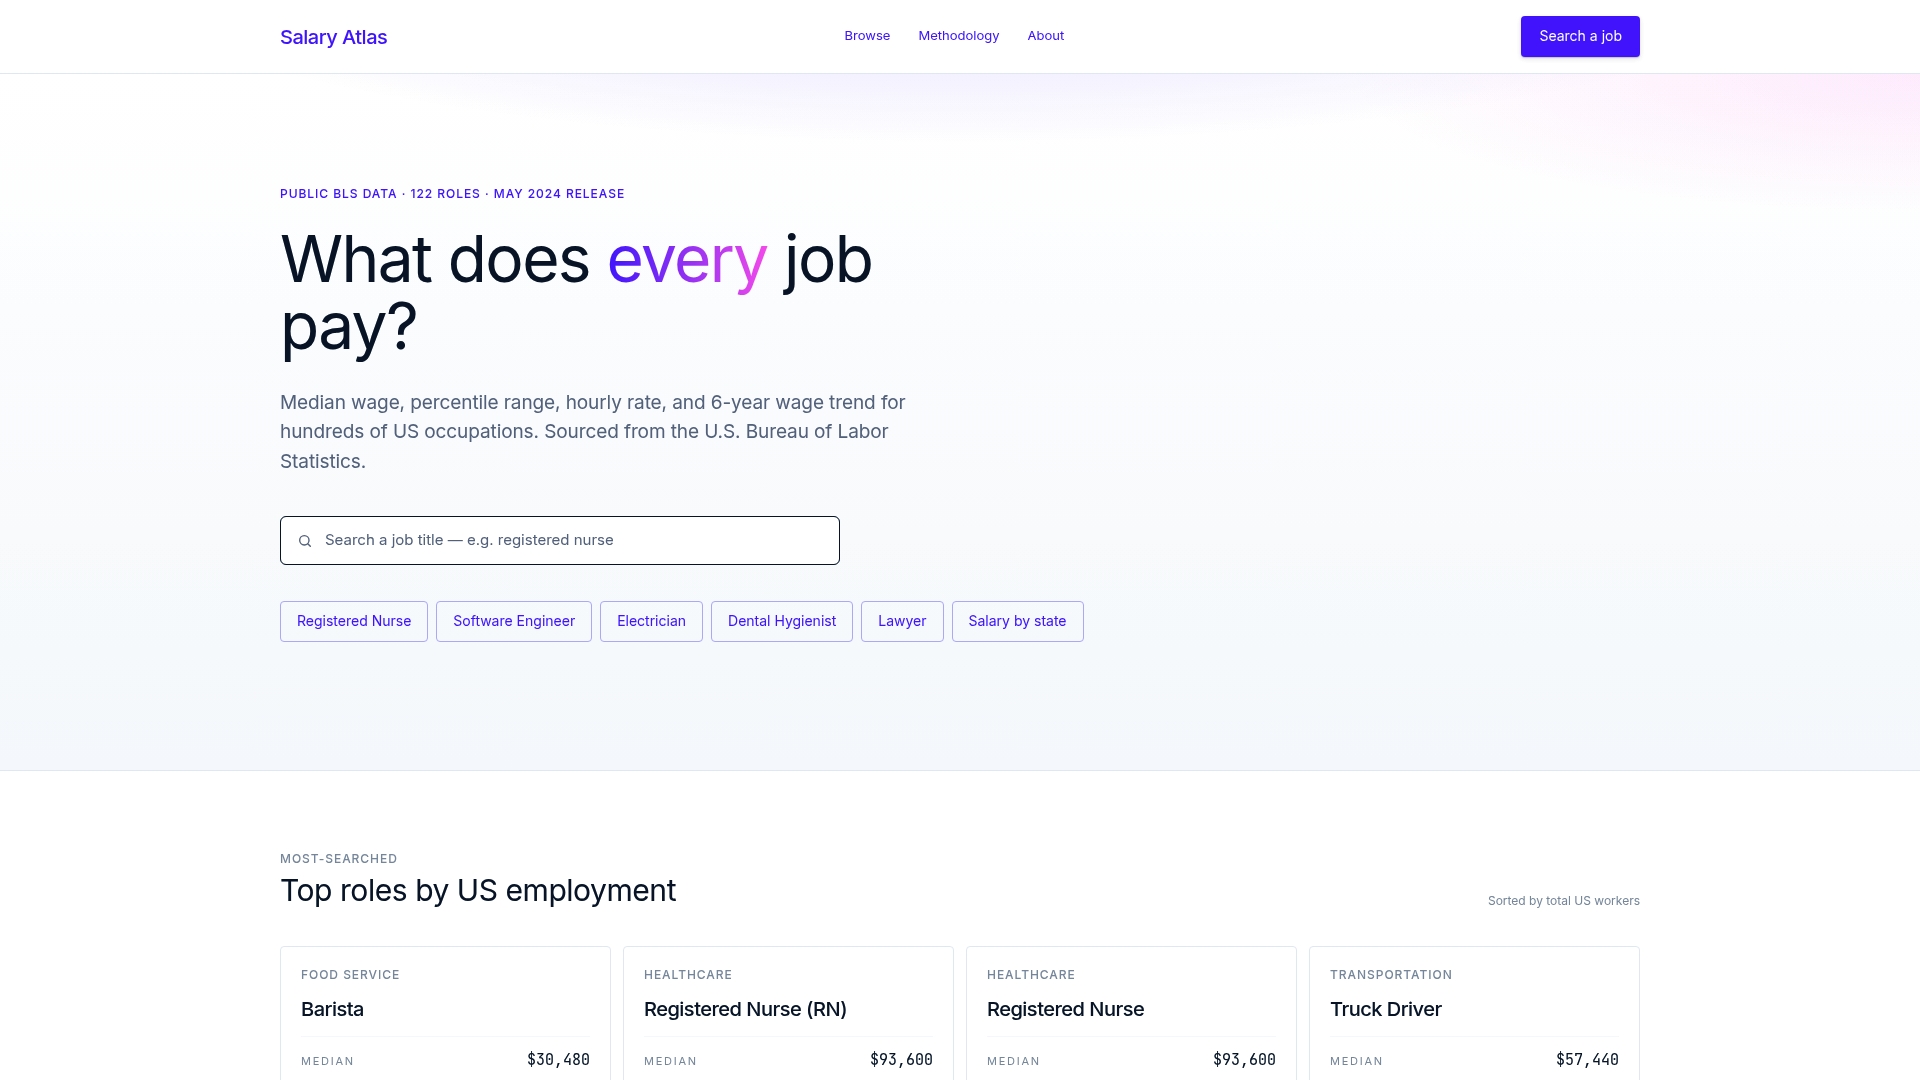
Beyond the state rankings, Salary Atlas's software engineer salary page breaks out percentiles and six-year trend charts, so you can see whether pay in your target state is climbing, flattening, or falling behind inflation. If you're comparing offers across state lines or setting a hiring budget for a distributed team, that trend context is often more useful than a single year's median. Head to Salary Atlas and pull up your state to see the full percentile breakdown before your next negotiation or budget conversation.
Sources
- What are the highest-paying states for software engineering?, edX
- Employment and wages / projections, ESD Washington
- Software Developer Salary in 2026: Job Outlook & Pay - Careers (U.S. News)
FAQ
Which State Pays the Most for Software Engineers?
California consistently ranks first in nominal terms, with Washington and New York close behind. Once you adjust for cost of living, some lower-ranked states offer better purchasing power for the same nominal salary.
Which Engineers Make $500,000 a Year?
Salaries near that level are typically limited to senior or principal engineers at large tech companies in expensive metros like San Francisco or Seattle, often including significant stock compensation on top of base pay. That figure sits far above the median for the role and isn't representative of typical software engineer pay by state.
Is AI Replacing Software Engineers?
AI tools are changing how engineers work, automating some routine coding tasks, but they're not broadly replacing the role. Demand for engineers who can design systems, review AI-generated code, and solve complex problems remains strong.
What Do L1, L2, L3, and L4 Engineer Levels Mean?
These are internal seniority tiers many tech companies use, roughly corresponding to entry-level (L1), mid-level (L2), senior (L3), and staff or principal (L4) engineers. Pay bands and percentile targets typically rise sharply at each level, which is why comparing salaries by level, not just by state, gives a more accurate picture.
Recommended
Occupation wage figures on Salary Atlas come from the U.S. Bureau of Labor Statistics. Figures in this article that are not linked to a source are estimates. See our methodology.