Average Merit Increase 2026: What HR Needs to Budget
 *
*
TL;DR:>
- The expected merit increase for 2026 is 3.5% based on employer surveys, though actual paid raises average around 3.1%. Budgeting remains flat compared to 2025, following a period of higher increases during inflation peaks in 2022 and 2023. HR should treat the 3.5% figure as a planning baseline, not a promise to every employee, and adjust for industry, role, and regional differences.*
The consensus average merit increase for 2026 is 3.5%, based on Willis Towers Watson's survey of 1,569 U.S. organizations, which matches the actual increases employers paid in 2025. Across the major surveys, planned budgets cluster in a 3.4%–3.6% range, with WorldatWork's data preview confirming the mid-3% consensus. The gap between planned and paid figures is real: iMercer's March 2026 survey of 756 employers found the mean merit increase actually paid out was 3.1%, down from a 3.2% mean in October, a reminder that budgets and paychecks are not the same number.
*Table of Contents
- What do the 2026 merit increase surveys actually show?
- How do merit increases vary by industry and company size?
- Merit increases vs. total pay increase budgets: what's the difference?
- How does 2026 compare to 2025 and recent years?
- How should HR use these numbers for budgeting and pay equity?
- What do the major surveys actually measure?
- How do survey budgets compare to BLS wage growth data?
- Key Takeaways
- The number you're quoting may not be the number your employees experience
- Salary Atlas gives HR a free, sourced benchmark for every role
- Useful sources for HR teams
- FAQ
What do the 2026 merit increase surveys actually show?
The table below pulls the headline figures from the four surveys HR teams cite most often. Read the "Type" column carefully before using any figure in a budget memo.
| Survey | Headline Merit % | Total Pay Budget % | Type | Fielding / Date | Sample |
|---|---|---|---|---|---|
| WTW / WorldatWork | 3.5% | 3.5% | Planned budget | 2025 (published 2025) | 1,569 U.S. orgs |
| WorldatWork SBS | ~3.5% | ~3.5% | Planned budget | 2025 | Multiple samples |
| iMercer (March 2026) | 3.1% | Not reported | Actual paid | March 2026 | 756 employers |
| Mercer / Payscale | ~3.4%–3.5% | ~3.5% | Planned budget | 2025 | Not publicly listed |
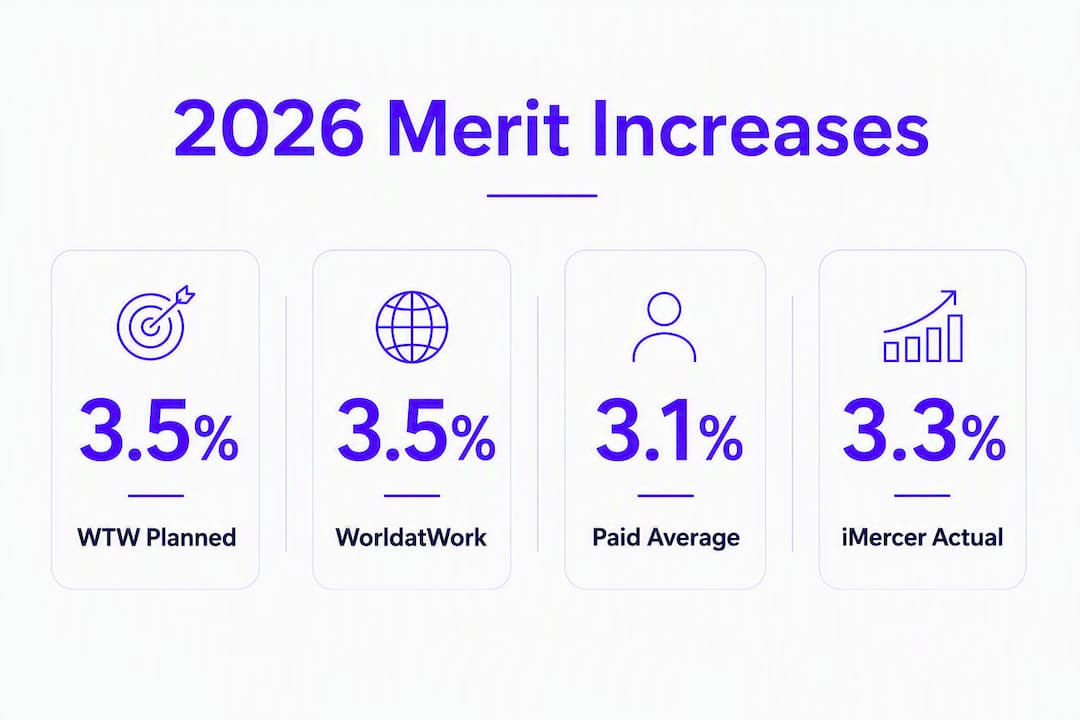
The surveys cluster tightly. WTW and WorldatWork both land at 3.5% for planned budgets, while iMercer's post-cycle payroll data shows the paid mean settling closer to 3.1%. That roughly 0.4-point gap is consistent with prior years: budgets absorb zeros for new hires, mid-year freezes, and market-adjustment pools that never reach base pay. Mercer's public guidance for 2026 similarly points to employers holding flat at around 3.4%–3.5%, with no broad acceleration in sight.
*How do merit increases vary by industry and company size?
Not every organization sits at 3.5%, and treating the national average as your target without checking your sector is one of the more common budgeting mistakes.
Industry patterns- Technology and life sciences companies have historically budgeted above the national mean, often in the 3.7%–4.2% range, driven by talent competition and higher voluntary turnover rates.
- Healthcare organizations tend to track close to the national average for clinical staff but sometimes run higher for specialized roles where shortages are acute.
- Manufacturing, retail, and hospitality sectors frequently come in at or slightly below the mean, partly because a larger share of their workforce receives market-rate adjustments through minimum wage changes rather than discretionary merit pools.
- Nonprofit and government-adjacent employers often budget lower, constrained by funding cycles and compensation governance structures that limit discretionary increases.
Smaller employers (under 500 employees) tend to show more variance around the mean. They can move faster when a key employee needs a retention increase, but they also have less budget cushion when revenue softens. Large employers (5,000+ employees) tend to cluster tightly around the survey mean because their compensation programs are more formalized and their finance teams hold the line on aggregate payroll cost.

When the headline 3.5% figure is misleading for your organization: if your industry competes heavily for a specific skill set, or if your voluntary turnover rate is running above 15%, the national average is a floor, not a target. Conversely, if your sector is contracting or your headcount is growing fast, the average may be higher than your budget can support.
*Merit increases vs. total pay increase budgets: what's the difference?
These two numbers get conflated constantly, and the confusion costs HR teams credibility with finance.

A merit increase is a permanent, performance-based addition to an employee's base salary. A total pay increase budget is the aggregate percentage of payroll an employer sets aside for all base-pay changes in a given cycle. That total pool typically includes merit increases, promotional increases, market adjustments (equity corrections), and sometimes step increases for tenure-based pay structures. It excludes bonuses, equity grants, and benefits changes.
Surveys often publish both because they measure different things. The total budget percentage is what finance approves. The merit-only slice is what managers actually distribute based on performance ratings.
A simple worked example: a company with 200 employees, an average salary of $70,000, and a 3.5% total budget has a pay increase pool of roughly $490,000 (200 × $70,000 × 0.035). If 0.5% of that pool is reserved for promotions and market adjustments, the merit-only pool is approximately $420,000, or 3.0% of payroll. That 0.5-point difference matters when you're calibrating the spread between a 2% increase for a "meets expectations" performer and a 5% increase for a top performer.
Pro Tip: Never hand managers the total budget percentage as if it were the merit percentage. Publish the merit-only pool separately, and hold the promotional and equity pools in reserve until mid-cycle reviews are complete. Releasing the full budget number early leads managers to over-promise increases before the performance calibration is done. *How does 2026 compare to 2025 and recent years?
The short answer: flat. WTW's data shows 2026 planned budgets holding steady at 3.5%, matching what employers actually paid in 2025. After the elevated increases of 2022–2023, when inflation pushed budgets above 4% at many organizations, the market has settled into a narrower band.
A few trend points worth keeping in a planning memo:
- 2022–2023 peak: Many employers ran merit budgets of 4.0%–4.5% in response to CPI inflation running above 7%. That was the highest sustained period in roughly two decades.
- 2024–2025 normalization: As inflation moderated, budgets pulled back toward the historical 3%–3.5% range. The 2025 actual mean of 3.5% reflects that normalization.
- 2026 outlook: Stable, not shrinking. The 3.5% planned figure is not a cut; it is employers signaling that the inflation-driven premium is gone but that they are not pulling back further.
Inflation context matters here. With CPI running closer to 2%–3% in 2025, a 3.5% merit budget represents a modest real wage gain for employees who receive it. The employees who receive zero, however, see a real pay cut in purchasing-power terms. That asymmetry is worth flagging in any communication plan. *
How should HR use these numbers for budgeting and pay equity?
Survey averages are inputs, not answers. Here is a short checklist before you finalize your merit pool.
Before submitting your budget to finance:- Run a pay-equity screen. Identify employees whose compa-ratio (current salary ÷ midpoint) is below 0.90. These employees may need a market adjustment funded separately from the merit pool, or your merit distribution will widen existing pay gaps.
- Check your turnover data by role and department. If voluntary turnover in a specific function is above your company average, a flat 3.5% budget may not be enough to retain that group.
- Confirm what the total budget covers. Get explicit sign-off from finance on whether promotional increases and market adjustments come from the same pool or a separate line item.
Merit pool = Headcount × Average base salary × Merit budget %
Example: 150 employees × $65,000 average salary × 3.5% = $341,250 merit pool
From there, allocate by performance tier. A common distribution: employees rated "exceeds expectations" receive 4.5%–5.5%, "meets expectations" receive 3.0%–3.5%, and "below expectations" receive 0%–1.5%. The weighted average of those tiers should land at or below your approved budget percentage.
Questions HR should bring to finance and business leaders:- Is the 3.5% budget a hard ceiling or a target with a variance band?
- Are market adjustments funded separately, or do they compete with merit dollars?
- What is the expected headcount change between now and the merit effective date? New hires added after the snapshot date can dilute the pool.
What do the major surveys actually measure?
Understanding the methodology behind a survey number is what separates a compensation professional from someone who just Googles the headline.
How surveys differ:- Employer-reported planned budgets (WTW, WorldatWork, Mercer, Payscale): Companies report what they intend to spend before the merit cycle runs. These are forward-looking and subject to revision.
- Payroll-paid actuals (iMercer post-cycle surveys): Companies report what was actually processed through payroll after the cycle closes. These are more accurate but arrive later.
- Employee-reported changes: Surveys that ask workers directly what raise they received. These tend to skew lower because employees who received zero are more likely to respond.
- A survey of 756 employers (iMercer's March 2026 sample) is statistically meaningful but may over-represent certain industries or employer sizes depending on who responded.
- WorldatWork's composite of 1,569 organizations provides broader coverage, but the mix of industries and company sizes in the sample still shapes the mean.
- Most planned-budget surveys include organizations that froze pay or gave zero increases. Those zeros pull the mean down from what merit-eligible employees actually received.
- Rounding conventions vary. A reported "3.5%" may represent anything from 3.45% to 3.54%.
- Timing gaps between survey fielding and your own merit cycle can be six to twelve months. A survey fielded in mid-2025 for a 2026 cycle may not capture economic shifts that occurred in late 2025.
How do survey budgets compare to BLS wage growth data?
Survey-reported merit budgets and BLS-measured wage growth are related but not the same metric. The Bureau of Labor Statistics tracks actual wage changes across the economy through the Employment Cost Index (ECI) and the Occupational Employment and Wage Statistics (OEWS) program. Survey budgets are employer intentions; BLS data is what showed up in paychecks economy-wide.
| Metric | 2026 Figure | Source | What it measures |
|---|---|---|---|
| WTW planned merit budget | 3.5% | WTW / WorldatWork survey | Employer-reported budget intention |
| iMercer paid merit mean | 3.1% | iMercer March 2026 survey | Actual payroll-processed increases |
| BLS ECI (wages & salaries) | Varies by quarter | Bureau of Labor Statistics | Economy-wide wage cost change |
For state-level calibration, average salary by state on Salary Atlas gives BLS-sourced figures that let you adjust merit targets for high-cost geographies like California or New York versus lower-cost markets in the Southeast.
*Key Takeaways
The 2026 average merit increase consensus sits at 3.5% for planned budgets, but actual paid increases have come in closer to 3.1%, and the gap matters for every budget memo you write this cycle.
| Point | Details |
|---|---|
| 2026 consensus budget | Major surveys cluster at 3.5% planned; WTW's 1,569-org sample confirms this figure. |
| Actual paid vs. planned | iMercer's March 2026 payroll data shows a 3.1% paid mean, roughly 0.4 points below planned budgets. |
| Trend direction | Budgets are flat versus 2025 actuals; the inflation-driven 4%+ era of 2022–2023 has passed. |
| HR budget formula | Headcount × average salary × merit % gives your pool; reserve 0.5% for promotions and market adjustments separately. |
| Salary Atlas for calibration | Salary Atlas BLS-sourced data by role and state lets HR validate internal pay ranges against real market figures at no cost. |
The number you're quoting may not be the number your employees experience
There is a persistent gap between how HR professionals talk about merit increases and how employees experience them. When a compensation team announces a "3.5% merit budget," most employees hear "I'm getting 3.5%." They are not. The budget is an average across the entire eligible population, and the distribution around that average is where the real story lives.
The surveys confirm this. A 3.5% planned budget produces a paid mean of around 3.1% once zeros, freezes, and mid-cycle adjustments work their way through payroll. The employees who received 5% are thrilled. The employees who received 1.5% feel shortchanged even though the budget was "generous." And the employees who received zero, often new hires inside a tenure window or employees on a performance plan, are invisible in the headline number.
The practical caution: before you communicate a merit budget to managers, build the distribution first. Decide what percentage of your population will receive above-average, average, and below-average increases, and make sure the weighted mean of that distribution lands at or below your approved budget. Announcing the headline percentage without that distribution plan is how organizations create expectations they cannot meet. The 3.5% figure is a useful market signal. It is not a promise to every employee.
*Salary Atlas gives HR a free, sourced benchmark for every role
Survey budgets tell you what the market intends to spend. They do not tell you whether your specific roles are already above or below market, which is the question that actually drives retention risk.
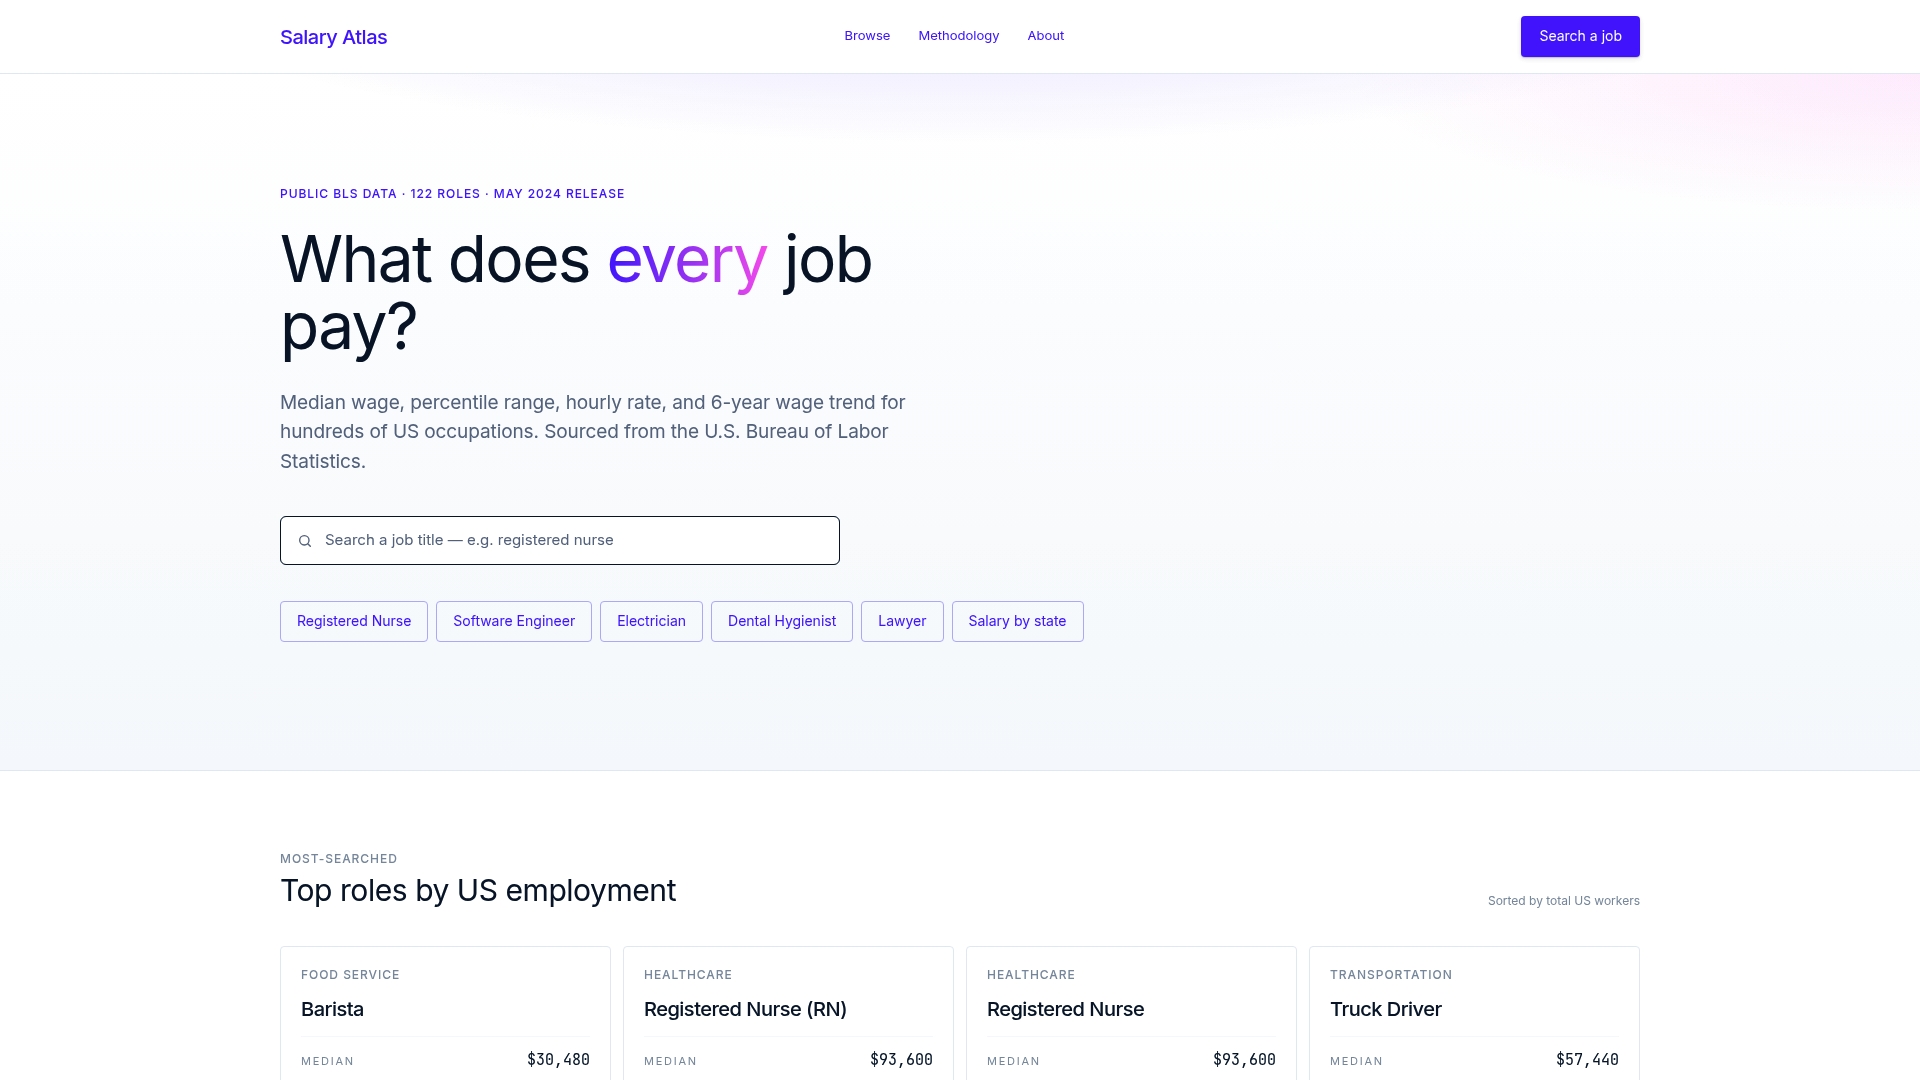
Salary Atlas pulls BLS OEWS wage data by job title, percentile, state, and experience level and publishes it without a paywall or signup. For HR teams running merit cycles right now, that means two concrete use cases:
- Role-level benchmarking: Pull the median and 75th-percentile wage for any occupation and compare it against your internal pay range midpoint before you finalize increases.
- State-level calibration: Use salary data by state to adjust merit targets for employees in high-cost markets without overpaying in lower-cost locations.
Every figure on Salary Atlas links back to its original BLS source, so you can cite it in an internal compensation report without a footnote caveat. Start with your highest-turnover roles and check where your pay ranges sit against current BLS percentiles. *
Useful sources for HR teams
These are the primary reports and data sources cited in this article. Each is worth bookmarking for your compensation planning files.
- WTW: 2026 U.S. Salary Increase Budgets Will Hold Steady at 3.5% — The headline WTW/WorldatWork finding from a 1,569-organization composite; the most-cited single figure for 2026 merit budgets.
- WorldatWork 2025–2026 Salary Budget Survey Top-Level Data Preview — The full data preview with cross-tabulations by industry and company size; useful for drilling below the headline mean.
- Salary Atlas — Market Compensation Analysis: 2026 HR Guide — Practical templates and worked examples for translating survey budgets into role-level merit allocations.
- Salary Atlas — Top 5 Salary Research Tools and Resources (2026) — Curated list of public and commercial data sources HR can use to validate pay decisions beyond survey averages.
- Salary Atlas — US Salary Data by Job Title — BLS-sourced occupation and state wage data, free and without a paywall; useful for role-level benchmarking alongside survey budgets.
*
FAQ
What is the average merit pay increase for 2026?
The consensus average merit increase for 2026 is 3.5% based on planned budgets from WTW's survey of 1,569 U.S. organizations. Actual paid merit increases, per iMercer's March 2026 payroll data, came in at a mean of 3.1%.
Is a 3% raise in 2026 good?
A raise below the 3.5% planned budget average is broadly in line with historical norms. Investopedia notes that average annual raises hover around typical market rates, so a 3% increase reflects a standard "meets expectations" outcome rather than a shortfall.
What is the average merit increase in America?
For 2026, the U.S. average merit increase budget is 3.5% based on major compensation surveys. Actual paid figures tend to run slightly lower once zeros and mid-year adjustments are factored in, with iMercer reporting a 3.1% paid mean for the 2026 cycle.
How does the 2026 average pay raise compare to 2025?
The 2026 planned budget of 3.5% matches the 2025 actual mean, meaning budgets are flat year over year. This follows a normalization from the 4%+ budgets many employers ran in 2022–2023 during peak inflation.
How should HR use the 3.5% figure when setting merit pools?
Treat 3.5% as a market-planning baseline, not a per-employee target. Calculate your total pool (headcount × average salary × budget %), reserve a portion for promotions and market adjustments, and build a performance-tiered distribution so the weighted average lands at or below the approved percentage.