Market Compensation Analysis: 2026 HR Guide
Unlock the power of market compensation analysis in 2026. Learn essential strategies to optimally set salaries and boost retention.
By the Salary Atlas editorial team · Published

TL;DR:
- Market compensation analysis compares internal pay to market benchmarks to ensure competitiveness and fairness. HR professionals should regularly perform this analysis, combining external data with internal pay equity to make informed salary decisions.
Market compensation analysis is the systematic comparison of internal pay rates to external market benchmarks to maintain competitive and equitable salary structures. HR professionals who run this process regularly see measurable results: regular benchmarking improves retention by 31% and speeds hiring by 40%. That retention lift alone justifies the investment. This guide walks through how to conduct a compensation market analysis, what 2026 market trends demand from HR teams, and how to apply findings to salary decisions that hold up under scrutiny. Salary Atlas provides free, BLS-sourced salary data that supports every stage of this process.
What is market compensation analysis and how is it conducted?

Market compensation analysis is the formal process of collecting external pay data, matching it to internal roles, and using the comparison to set or validate pay ranges. The industry also calls this "market pricing" or "salary benchmarking." Both terms describe the same core method: measuring where your pay sits relative to the market.
The process follows a clear sequence.
- Define the scope. Identify which roles need analysis. Prioritize high-turnover positions, hard-to-fill roles, and any job where recent offers have been declined.
- Gather market data. Pull from multiple sources: published salary surveys, job posting databases, and government labor statistics. Job postings with salary ranges reached 68% of listings in 2025, up from 45% in 2023. That shift makes posting data far more useful for real-time benchmarking than it was two years ago.
- Match jobs accurately. Compare roles by scope, responsibility, and level, not just title. A "Senior Analyst" at one company may function at a manager level at another. Mismatched job comparisons produce misleading data.
- Age and trend the data. Survey data is always historical. The Employment Cost Index recorded 5.1% year-over-year wage inflation in 2022, which illustrates how fast stale data drifts from reality. Apply a trending factor to bring older figures forward to the current date.
- Choose a market position. Decide where your organization wants to sit relative to the market. Targeting the 50th–65th percentile balances cost and competitiveness for most roles. Scarce or critical roles warrant the 65th–80th percentile.
- Build pay ranges. Set a midpoint at your target percentile, then apply a range spread. Broader spreads accommodate longer career progressions within a grade.
How do market compensation trends and data impact salary setting in 2026?
The 2026 compensation market is not moving in one direction. It is splitting by level, function, and geography in ways that make a single annual survey insufficient.
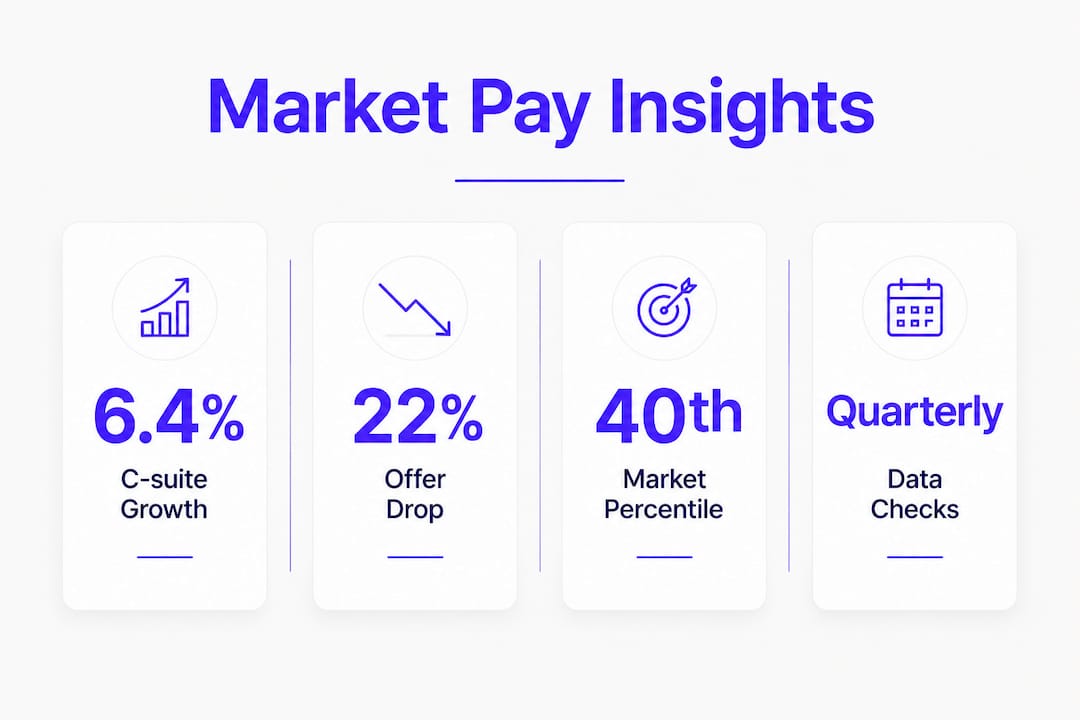
- Level bifurcation is real. C-suite pay grew 6.4% in 2026 while director-level pay declined 0.6%. That gap means the same survey can show very different signals depending on which level you are analyzing.
- Function-specific inflation continues. Tech, finance, and healthcare roles are seeing above-average pay pressure. A data scientist salary or a loan officer's compensation can shift significantly within a single year in these sectors.
- Geographic differentials are widening. Remote work created pay compression across regions, but many employers are now reintroducing location-based adjustments. State-level data helps HR teams calibrate these differences accurately.
- Sign-on grants have become a structural tool. VP-level sign-on grants doubled from $75,000 in 2023 to $145,000 in 2025. Organizations use these grants to close compensation gaps without permanently raising base salary, which keeps fixed costs manageable.
- Survey lag creates risk. Traditional surveys close data collection six to twelve months before publication. In a volatile market, that lag means your benchmarks may already be outdated by the time you use them.
| Compensation element | 2023 baseline | 2025/2026 shift |
|---|---|---|
| C-suite base pay growth | ~3% annually | 6.4% in 2026 |
| Director-level base pay | Positive growth | Declined 0.6% |
| VP sign-on grants | $75,000 median | $145,000 median |
| Job postings with salary ranges | 45% | 68% |
What challenges should HR professionals watch for in compensation analysis?
Compensation structure analysis surfaces tradeoffs that are easy to miss when you focus only on external competitiveness. The most common pitfalls are internal, not external.
Pay compression is the most immediate risk. Strict market pricing can push new hire salaries above those of experienced incumbents. When a five-year employee earns less than a new hire in the same role, morale drops and voluntary exits follow. Compression is not a hypothetical. It is a predictable outcome of chasing market rates without auditing internal equity at the same time. Outdated data creates false confidence. An HR team that runs benchmarking once every two years and applies the results as if they are current is operating on assumptions, not analysis. The market pay assessment process only works when the data reflects current conditions.Pay transparency laws add a compliance layer. More than a dozen U.S. states now require salary ranges in job postings. This forces HR teams to publish ranges that are defensible, not just competitive. A range that looks reasonable against the market but cannot be explained to a current employee creates legal and cultural risk. Role criticality requires differentiated treatment. Not every role deserves the same market position. A customer-facing sales role with direct revenue impact warrants a higher percentile target than a back-office administrative position. Applying one percentile target across the board is a common mistake that wastes budget and still leaves critical roles underpaid.Balancing market competitiveness with internal fairness is not optional. Organizations that chase external benchmarks without auditing internal pay gaps create two problems at once: they overpay new hires and underpay loyal employees. The result is attrition from both ends of the tenure spectrum.
How to apply market compensation analysis to improve pay decisions
Translating benchmark data into actual pay decisions requires a structured process, not a one-time spreadsheet exercise. The following steps move analysis into practice.
- Set a benchmarking cadence with joint ownership. HR and Finance should co-own the process. HR brings market knowledge; Finance controls budget constraints. Annual full reviews with quarterly spot checks for high-demand roles is the standard cadence that works in most organizations.
- Use compa-ratio to diagnose individual pay. Compa-ratio divides an employee's actual pay by the midpoint of their pay range. A ratio below 0.85 signals underpayment relative to market. A ratio above 1.15 signals overpayment or a promotion candidate. This metric turns market data into individual-level decisions.
- Run pay equity analysis alongside benchmarking. Combining salary benchmarking with internal pay equity analysis reduces voluntary turnover by up to 28%. Market data tells you where you stand externally. Equity analysis tells you whether pay is distributed fairly within your own organization. You need both.
- Monitor high-demand roles continuously. Roles in data science, cybersecurity, and healthcare are moving faster than annual surveys can track. Compensation intelligence merges real-time external market data with internal pay information, revealing gaps that periodic audits miss entirely.
- Communicate your compensation strategy clearly. Employees who understand how their pay is set are less likely to leave over compensation concerns. Transparency does not mean sharing everyone's salary. It means explaining the framework: what percentile you target, how ranges are built, and how performance affects pay.
The table below shows how market position strategy shifts by role type.
| Role type | Recommended market position | Rationale |
|---|---|---|
| Standard operational roles | 50th–60th percentile | Balances cost with adequate competitiveness |
| High-demand technical roles | 65th–80th percentile | Reflects scarcity and replacement cost |
| Executive and C-suite roles | 75th percentile and above | Aligns with market bifurcation trends |
| Entry-level and high-volume roles | 45th–55th percentile | Volume hiring requires cost discipline |
Key Takeaways
Market compensation analysis works only when external benchmarks, internal equity data, and a clear market position strategy operate together as a single system.
| Point | Details |
|---|---|
| Benchmark regularly | Annual reviews with quarterly spot checks prevent pay from drifting below competitive levels. |
| Match jobs precisely | Comparing roles by scope and level, not just title, produces accurate and usable market data. |
| Differentiate by role criticality | Set higher percentile targets for scarce or high-impact roles rather than applying one target across all positions. |
| Combine equity and market data | Pairing benchmarking with internal pay equity analysis reduces voluntary turnover by up to 28%. |
| Communicate the framework | Explaining your pay strategy to employees reduces compensation-driven attrition more than small pay increases alone. |
Why compensation data quality is the real differentiator
I have spent years watching HR teams run compensation reviews that produce confident-looking spreadsheets built on shaky data. The analysis looks thorough. The percentile targets are documented. The pay ranges are neatly formatted. And then a key employee leaves because a competitor offered $20,000 more, and nobody saw it coming.
The problem is almost never the framework. It is the data feeding it. Traditional salary surveys are self-reported, lagged by six to twelve months, and often skewed by the companies that choose to participate. Real-time job posting data, sourced from actual hiring activity, reflects what employers are genuinely willing to pay right now. The gap between those two signals is where attrition hides.
The other thing I have seen consistently underestimated is the internal equity piece. HR teams treat market benchmarking and pay equity analysis as separate workstreams. They are not. Senior executive pay structures are evolving with performance-vesting equity and sign-on grants precisely because organizations are trying to close gaps without blowing up their base salary budgets. The same logic applies at every level. You cannot fix a retention problem by chasing market rates if your internal pay distribution is creating resentment among your longest-tenured employees.
The organizations that get this right treat compensation data as a continuous input, not an annual project. They monitor, adjust, and communicate. That combination is what actually moves retention numbers.
, Joelen Zyoktova
Salary Atlas makes market pay analysis accessible
HR teams need reliable, current salary data to run a credible compensation market analysis. Salary Atlas provides free access to U.S. salary data sourced directly from the Bureau of Labor Statistics, covering hundreds of job titles with no paywall and no registration required.
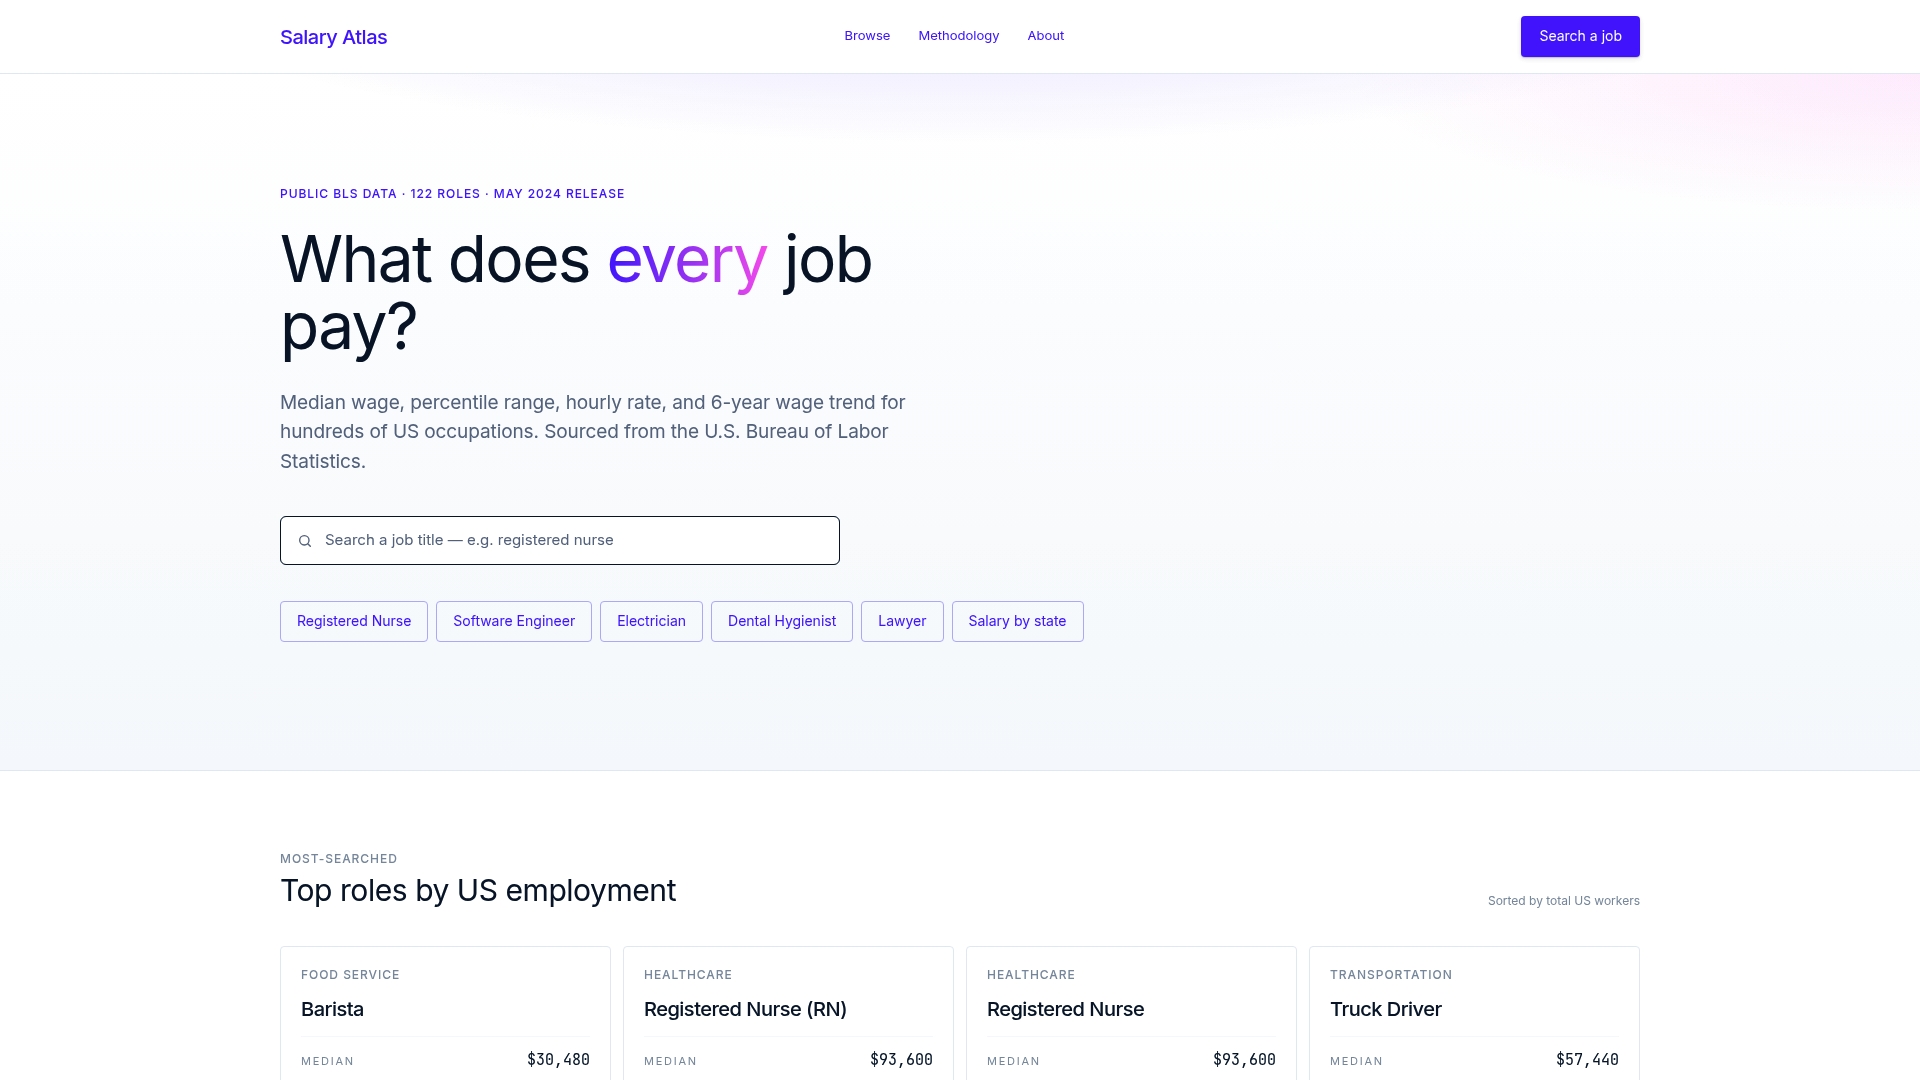
Every figure on Salary Atlas links back to its original BLS source, so you can cite the data with confidence in compensation reviews and board presentations. The platform covers role-specific trends across six years, giving HR professionals the historical context needed to spot shifts in market pay by state or track how a specific role's compensation has moved over time. Whether you are benchmarking a data analyst's salary or reviewing pay for an executive assistant, Salary Atlas gives you a verified starting point for every compensation decision. Visit Salary Atlas to start your next market pay assessment with data you can trust.
FAQ
What is market compensation analysis?
Market compensation analysis is the process of comparing your organization's internal pay rates to external salary benchmarks to determine whether your compensation is competitive. It uses data from salary surveys, job postings, and government labor statistics to set or validate pay ranges.
How often should HR teams run a compensation market analysis?
A full compensation market analysis should run annually, with quarterly spot checks for high-demand or hard-to-fill roles. Regular benchmarking improves retention by 31% and reduces the risk of losing employees to better-paying competitors.
What happens when salary falls below the 40th market percentile?
Offer acceptance rates drop 22% when salary falls below the 40th market percentile. That drop signals that candidates are actively comparing your offers to market rates and choosing competitors.
What is the difference between compensation intelligence and a pay audit?
A pay audit reviews internal pay data for equity and compliance. Compensation intelligence combines live external market data with internal pay information to identify gaps before they cause attrition. Audits look backward; compensation intelligence works in real time.
How do I choose the right market percentile target for my organization?
Target the 50th–65th percentile for most roles to balance cost and competitiveness. Use the 65th–80th percentile for scarce or high-impact roles where replacement costs are high and talent supply is limited.
Recommended
Occupation wage figures on Salary Atlas come from the U.S. Bureau of Labor Statistics. Figures in this article that are not linked to a source are estimates. See our methodology.