The Gender Pay Gap in the US: What the Numbers Actually Show
Explore the latest insights on the gender pay gap in the US, revealing disparities in earnings and how different methodologies impact the numbers.
By the Salary Atlas editorial team · Published
Women working full-time, year-round in the United States earned about 83 cents for every dollar men earned in 2024, according to the Census Bureau. That's the unadjusted, raw figure. Look at a different dataset and the number shifts: the Institute for Women's Policy Research (IWPR) puts it at 80.9 cents, down from 82.7 cents in 2023, one of the sharpest single-year drops since the 1960s. Pew Research Center, measuring hourly wages instead of annual earnings, finds women earned about 85% of men's pay in 2024.
Three respected sources report different pay gap figures depending on methodology including whether annual or hourly pay is measured, the worker sample, and whether adjustments are made for occupation and experience.
- Unadjusted (raw) gap: Compares all women's earnings to all men's earnings with no controls. This is the widest gap and the one most often quoted.
- Adjusted (controlled) gap: Compares workers with similar jobs, hours, and experience. This shrinks the gap but doesn't erase it.
Key Takeaways
The US gender pay gap sits between 80.9 cents and 85 cents per dollar depending on the dataset, and the most recent year-over-year trend points toward widening rather than narrowing.
| Point | Details |
|---|---|
| No single "correct" number | The gap ranges from 80.9 cents to 85 cents per dollar depending on whether you use annual, hourly, adjusted, or unadjusted measures. |
| Recent trend is negative | IWPR reports the gap widened for a second consecutive year in 2024, dropping to 80.9 cents from 82.7 cents. |
| Race and occupation widen disparities | Black and Hispanic women, along with workers in construction and production occupations, face gaps well beyond the national average. |
| Legal protections exist but require action | The Equal Pay Act and Lilly Ledbetter Fair Pay Act give workers legal recourse, but filing a charge requires documentation and a deadline-driven process. |
| Verify your own pay against sourced data | Use BLS, ACS, or Salary Atlas job-level pages to compare your pay by state, percentile, and experience before negotiating or filing a complaint. |
Table of Contents
- How Big Is the Gender Pay Gap in the US Right Now?
- Has the Gender Pay Gap in the US Widened or Narrowed Recently?
- Which Groups Face the Largest Pay Gaps?
- What Causes the Gender Pay Gap in the United States?
- What Laws Protect Equal Pay in the US?
- Does Government Policy Actually Close the Pay Gap?
- Does the Gender Pay Gap Vary by State?
- How Do You Check If You're Being Paid Fairly?
- Where to Verify These Numbers Yourself
- Why the Loudest Pay Gap Headlines Miss the Real Story
- Sources
- FAQ
How Big Is the Gender Pay Gap in the US Right Now?
The short answer sits between 80 and 85 cents on the dollar, depending on which government or research dataset you check. Here's the quick reference most readers actually need, with each figure tied to its source and year.
- 83%, Women's median annual earnings as a share of men's, full-time year-round workers, 2024 (Census Bureau)
- 80.9 cents per dollar, IWPR's 2024 full-time year-round wage ratio, down from 82.7 cents in 2023 (IWPR)
- 85%, Median hourly earnings ratio for full- and part-time workers, 2024 (Pew Research Center)
- Equal Pay Day, Usually falls in March; it marks how far into the following year the average woman must work to earn what the average man earned the prior year alone.
| Figure | Measure | Dataset | Year |
|---|---|---|---|
| 83% | Median annual earnings ratio, full-time year-round | Census/ACS | 2024 |
| 80.9 cents | Full-time year-round wage ratio | IWPR analysis | 2024 |
| 85% | Median hourly earnings ratio, full- and part-time | CPS (Pew analysis) | 2024 |
| Varies by education | Median weekly earnings by sex and education | BLS/DOL | Ongoing series |
None of these terms are interchangeable, and swapping them is the single biggest source of confusion when people compare pay-gap statistics from different outlets.
Has the Gender Pay Gap in the US Widened or Narrowed Recently?
The most recent year-over-year movement points the wrong way. The IWPR's 2024 analysis found women's full-time year-round earnings fell to 80.9 cents per dollar, down from 82.7 cents in 2023. That's the second consecutive annual decline, and IWPR calls it one of the largest single-year deteriorations recorded since the 1960s.
That finding sits in some tension with the longer 20-year view. Pew Research, using CPS-based median hourly earnings, finds the gap has narrowed slightly over the past two decades, with younger workers showing a noticeably smaller gap than older cohorts. Both things can be true at once: a multi-decade narrowing trend can still include recent years where the gap widens again, especially if men's earnings grow faster than women's in a particular stretch.
Here's a simplified look at how the headline ratio has moved in recent years, based on the datasets that track it:
| Year | Full-time, year-round ratio | Dataset |
|---|---|---|
| , | 83% | Census/ACS |
| 2023 | 82.7 cents per dollar | IWPR analysis |
| 2024 | 83% (Census) / 80.9 cents (IWPR) | Census/ACS, IWPR |
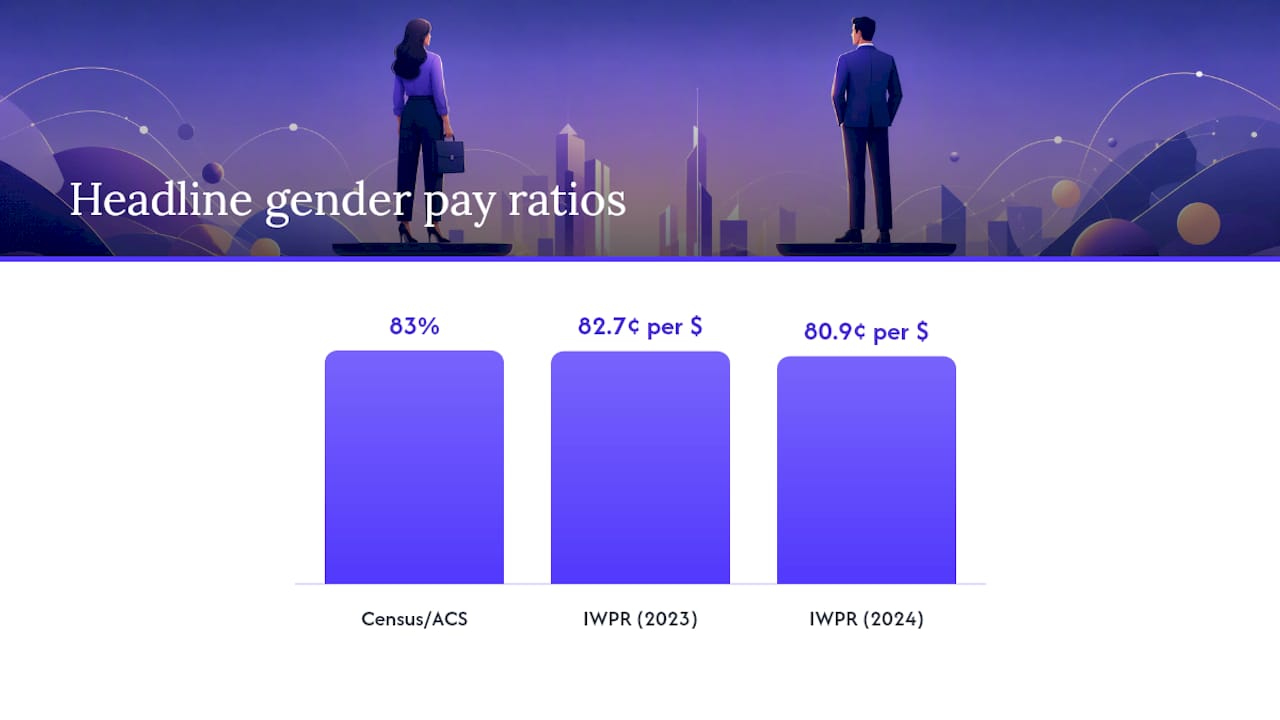
The discrepancy between the Census's 83% and IWPR's 80.9 cents for the same year isn't a contradiction. It reflects slightly different sample definitions and weighting choices between the two organizations' methodologies. Both are legitimate; neither is "the" official number, because no single official number exists.
What's driving the recent stall or reversal? Analysts point to a few overlapping factors. Men's median earnings have grown faster than women's in some recent years, partly reflecting stronger wage growth in male-dominated sectors like construction and skilled trades coming out of pandemic-era labor shortages. Occupational shifts matter too: when high-paying blue-collar and technical jobs see faster wage growth than the service and care-sector jobs where women are concentrated, the aggregate ratio moves against women even without any single employer changing its pay practices.
- The pandemic-era "she-cession" pushed many women out of the workforce temporarily, and re-entry patterns have been uneven across industries.
- Wage growth in high-paying, male-dominated fields (construction, logistics, skilled trades) has outpaced growth in lower-paying, female-dominated fields (education, health support, retail).
- Part-time work remains more common among women, which drags down annual earnings comparisons even when hourly wages are closer to parity.
None of this means progress has stalled entirely. It means the trajectory isn't a straight line, and any single year's headline can move against the longer-term direction. Readers checking pay-gap statistics for 2025 to 2026 should expect this back-and-forth to continue until new full-year data confirms whether 2024's decline was a blip or the start of a longer reversal.
Which Groups Face the Largest Pay Gaps?
The 83% national average hides enormous variation. Break it down by race, age, education, or occupation, and some groups face gaps twice as wide as others.
- Race and ethnicity: Gaps are far from uniform. Asian American women tend to see the smallest gap relative to White men's earnings, while Black and Hispanic women face substantially wider gaps, often earning considerably less than 83 cents on the dollar when compared against White men's median earnings, according to IWPR's breakdowns.
- Age: Younger workers show a narrower gap than older workers. Pew's analysis finds workers early in their careers face a smaller pay difference, one that tends to widen as workers age, likely reflecting the compounding effect of caregiving interruptions and slower promotion tracks over time.
- Education: The BLS/DOL weekly earnings series shows the gap persists at every education level, from high school diplomas through advanced degrees. Higher education narrows it somewhat but does not close it.
- Occupation and industry: The widest ratios show up in Natural Resources, Construction, Maintenance, and Production/Transportation occupations, fields where women remain a small share of the workforce and the Census Bureau reports notably lower median ratios for the women who do work in them.
- Public vs. private sector: Government jobs generally run on more standardized pay scales and structured job classifications, which tends to narrow the gap compared to private-sector roles where pay negotiation plays a bigger part.
Occupational segregation drives a lot of this. Women remain a small minority in the highest-paying trades and technical fields, while representing a majority in lower-paying care and service roles. That's not a coincidence of individual choice alone. It reflects decades of hiring patterns, workplace culture, and access to training pipelines that steer men and women toward different jobs before pay negotiations ever start.

What Causes the Gender Pay Gap in the United States?
No single cause explains the gap. It's a layered problem, and separating the "explained" portion (differences researchers can attribute to measurable factors) from the "unexplained" portion (what's left after controlling for those factors) is how economists try to isolate potential discrimination from other dynamics.
- Occupational segregation: Men and women cluster into different jobs and industries, and male-dominated fields simply pay more on average, particularly in skilled trades and technical roles.
- Hours and part-time work: Women work part-time at higher rates than men, largely tied to caregiving responsibilities, which lowers annual earnings even when hourly wages are comparable.
- Caregiving and career interruptions: Time out of the workforce for childbirth, childcare, or eldercare creates lasting earnings penalties, sometimes called the "motherhood penalty." A review of the evidence connects these interruptions to measurable long-term earnings losses that persist even after women return to work.
- Promotion and negotiation gaps: Men are promoted at higher rates in many organizations and negotiate salary increases more often, compounding earnings differences over a career.
- Pay-setting practices and bias: Some portion of the gap resists explanation by any measurable factor, which researchers treat as a proxy for discrimination, informal bias, or unmeasured differences in how pay gets set.
Race and ethnicity interact with every one of these drivers rather than sitting alongside them as a separate issue. Women of color are more likely to work in occupations with less flexible scheduling, face steeper caregiving penalties due to fewer resources for paid childcare, and encounter compounding bias tied to both race and gender in hiring and promotion decisions.
What Laws Protect Equal Pay in the US?
Federal law has addressed pay discrimination for over 60 years, though enforcement and coverage gaps remain part of the ongoing debate. Understanding pay parity versus pay equity matters here: parity means equal pay for the same work, the legal minimum. Equity is broader, an organizational commitment to valuing different roles fairly that many employers pursue beyond what the law requires.
- Equal Pay Act of 1963: Requires equal pay for substantially equal work performed under similar conditions, with narrow exceptions for seniority, merit, production-based pay systems, or any factor other than sex, according to the EEOC.
- Title VII of the Civil Rights Act of 1964: Prohibits broader employment discrimination based on sex, race, color, religion, and national origin, covering hiring, promotion, and pay decisions beyond the narrower Equal Pay Act scope.
- Lilly Ledbetter Fair Pay Act of 2009: Reset the clock on pay discrimination claims, allowing workers to file a claim within 180 days of each discriminatory paycheck rather than only within 180 days of the original pay-setting decision.
- EEOC enforcement: The Equal Employment Opportunity Commission investigates charges, can pursue mediation or litigation, and publishes guidance on what counts as pay discrimination.
Does Government Policy Actually Close the Pay Gap?
Some interventions have real evidence behind them. Others sound good but show mixed results once researchers measure the actual outcomes.
- Pay transparency laws: Requiring employers to post salary ranges tends to reduce visible inequities, though IWPR notes the effect on actually raising women's wages is mixed and depends heavily on enforcement.
- Paid family leave: Access to paid leave helps women stay attached to the workforce through caregiving periods, reducing the long-term earnings penalty tied to career interruptions.
- Higher minimum wage: Since women are overrepresented in minimum-wage and near-minimum-wage jobs, raising the floor narrows the gap at the bottom of the wage distribution specifically.
- Unionization: Unionized workplaces tend to have more standardized pay scales, which generally narrows gender pay differences compared to non-union settings.
- Structured pay bands and standardized job evaluation: Employers that set clear salary bands tied to role and level, rather than individual negotiation, tend to see smaller unexplained pay gaps.
- Blind screening and calibrated promotion reviews: Removing identifying information during early hiring stages and using structured criteria for promotion decisions reduces the influence of unconscious bias.
Does the Gender Pay Gap Vary by State?
Geography matters more than most people expect. States with a heavy concentration of unionized public-sector jobs or a smaller share of high-paying, male-dominated industries tend to show narrower gaps. States built around extraction, construction, or manufacturing, industries where men are heavily overrepresented in the highest-paying roles, tend to show wider ones.
This isn't a fixed ranking. It shifts year to year depending on which dataset and measurement year you check, so treat any specific state list as a snapshot rather than a permanent fact.
- Industry mix: A state economy weighted toward tech, finance, or professional services usually shows a different gap pattern than one weighted toward oil, gas, or heavy manufacturing.
- Labor force composition: States with higher female workforce participation in mid- and high-wage sectors tend to post smaller gaps.
- State-level policy: States with their own pay transparency or equal pay statutes stronger than federal minimums often see measurably different outcomes.
- Cost of living: Raw dollar comparisons don't account for regional cost differences, so a narrower percentage gap in an expensive metro area doesn't necessarily mean better real purchasing power parity.
How Do You Check If You're Being Paid Fairly?
Comparing your own pay against reliable benchmarks takes about ten minutes if you know where to look.
- Find your exact job title on Salary Atlas or the BLS Occupational Employment and Wage Statistics database. Job titles vary widely between employers, so match by actual duties, not just the title on your business card.
- Select your state or metro area. Wages for the same job title can differ by tens of thousands of dollars between, say, San Francisco and a smaller Midwest metro.
- Choose the relevant percentile and experience level. A median (50th percentile) figure tells you the midpoint, but if you have five years of specialized experience, compare against the 75th percentile instead.
- Compare total compensation, not just base salary. Factor in bonuses, equity, and benefits, since a lower base salary paired with strong benefits can still add up to competitive total pay.
- Record your findings: note the percentile, dataset, and year for each figure you pull, so you have a documented comparison if you ever need to raise the issue with your employer or file a complaint.
Where to Verify These Numbers Yourself
- Census Bureau / ACS: Annual median earnings by sex, education, and occupation; the source for the headline 83% figure.
- BLS/Department of Labor: Median weekly earnings by education and sex, updated on an ongoing basis.
- EEOC: Legal framework and enforcement guidance for pay discrimination claims.
- IWPR and Pew Research Center: Independent analyses offering different methodological angles on the same underlying trend.
- Salary Atlas methodology: How job-level and state-level salary figures get sourced and refreshed from BLS data.
Why the Loudest Pay Gap Headlines Miss the Real Story
The public conversation about the gender pay gap tends to collapse into a single number, then argue about whether that number is real. That's the wrong fight. Every credible source, Census, IWPR, Pew, agrees the gap exists; they just measure different slices of it. The more useful question isn't "is it 83 cents or 85 cents," it's "why does the gap widen so much once you look at race, occupation, and age together."

That's where the conventional advice falls short; for practical financial tips that empower women to navigate pay disparities, see this financial literacy for women guide (note: UK policy specifics differ). Telling women to "negotiate harder" treats an occupational and structural problem as an individual failing. The evidence points toward occupational segregation and caregiving penalties as bigger levers than negotiation skill alone.
If you take one action after reading this, make it a data check, not a grievance. Pull your own job title and state from a sourced dataset, see where you actually land against the median, and use that number, not a national headline, in any conversation with your employer.
Sources
The gap you see depends entirely on the measurement method, and understanding these methods is the fastest way to stop being confused by conflicting headlines.
- Equal Pay Day: Census Bureau newsroom story
- Department of Labor, Median weekly earnings by educational attainment and sex
- EEOC, Equal Pay Act of 1963
FAQ
What State Has the Widest Gender Pay Gap?
The widest and narrowest state gaps shift year to year, but states with economies weighted toward construction, manufacturing, and extraction industries generally show wider gaps than states with larger public-sector and professional-services workforces. Check the BLS state-level wage data for the current year's specific figures.
What Country Has the Highest Gender Pay Gap?
This article focuses on U.S. data rather than international rankings, and cross-country comparisons use different methodologies that make direct comparisons unreliable without matching definitions. For U.S.-specific figures, the Census Bureau's 83% median earnings ratio is the most consistently cited benchmark.
Why Is There a Gender Pay Gap in the United States?
The gap stems from a mix of occupational segregation, differences in hours worked, caregiving-related career interruptions, promotion and negotiation disparities, and a residual "unexplained" portion that researchers link to bias in pay-setting practices. No single factor accounts for the entire gap.
How Much Does a Woman Earn for Every $1 a Man Earns?
Depending on the dataset, women earn between 80.9 cents (IWPR, 2024 annual figure) and 85 cents (Pew Research, 2024 hourly figure) for every dollar a man earns, with the Census Bureau's commonly cited figure at 83 cents.
What Is the Difference Between Pay Parity and Pay Equity?
Pay parity means equal pay for the same work, the legal minimum required by the Equal Pay Act. Pay equity is a broader concept where organizations evaluate whether different roles are valued and compensated fairly relative to their actual contribution, going beyond what federal law strictly requires.
How Does the Gender Pay Gap Affect Retirement Savings?
Lower lifetime earnings translate directly into smaller Social Security benefits and reduced retirement savings, since both are calculated based on career earnings history. The GAO notes this compounding effect makes the pay gap a multi-decade financial issue rather than just an annual pay difference.
Recommended
Occupation wage figures on Salary Atlas come from the U.S. Bureau of Labor Statistics. Figures in this article that are not linked to a source are estimates. See our methodology.