Average Salary by State: U.S. Median and Mean Wages
 *
*
TL;DR:>
- The median full-time salary in the United States is approximately $61,702, with significant variation across states. Higher-paying states like DC and Massachusetts have concentrated industries that boost wages, while states like Mississippi and West Virginia have lower medians due to industry structure. Adjusting for cost of living reveals that nominal salary differences often do not translate into higher real purchasing power.*
The national median full-time salary in the United States sits at approximately $61,702, based on compiled ACS and BLS data. The District of Columbia leads all jurisdictions at $102,970 (Visual Capitalist compilation of ACS/BLS data), while Mississippi anchors the bottom near $50,120 (Visual Capitalist compilation of ACS/BLS data). The gap between the highest and lowest state medians exceeds $50,000 (Visual Capitalist compilation of ACS/BLS data), which means where you live can matter as much as what you do.
Quick snapshot of the extremes:
- Top 3 by median full-time salary: District of Columbia ($102,970), Massachusetts ($79,113, Visual Capitalist compilation of ACS/BLS data), Washington ($76,323, Visual Capitalist compilation of ACS/BLS data)
- Bottom 3 by median full-time salary: Mississippi ($50,120, Visual Capitalist compilation of ACS/BLS data), Arkansas, Louisiana
The full 50-state table is in the section below, sourced from the U.S. Bureau of Labor Statistics Occupational Employment and Wage Statistics (OEWS) program. Every figure links back to its primary source.
Table of Contents
- What does "average salary" actually mean?
- Average salary by state: full 50-state data table
- Which states pay the most and least?
- How to compare purchasing power across states
- Should you move for higher pay? A practical checklist
- How Salary Atlas compiled these numbers
- Key Takeaways
- The real story behind state salary rankings
- Free state salary tools from Salary Atlas
- Useful sources and further reading
- FAQ
What does "average salary" actually mean?
Two numbers dominate every state salary comparison: the mean and the median. They measure different things, and mixing them up leads to bad decisions.
The mean (what most people call "the average") adds up all wages in a state and divides by the number of workers. A handful of executives earning $500,000 pulls the mean up for everyone. The median is simpler: line up all workers by pay, and the person in the exact middle is the median. Half earn more, half earn less.
A quick example: five salaries of $30k, $40k, $50k, $60k, and $200k produce a mean of $76k but a median of $50k. The mean looks great; the median tells you what a typical worker actually earns.
When to use each:- Median is the right number for job seekers and relocators. It reflects what a typical worker in that state takes home, not what a few high earners inflate the figure to.
- Mean matters when you are analyzing total labor market spending, employer budget benchmarks, or comparing a state's overall economic output.
Salary Atlas reports the BLS OEWS mean annual wage as the primary column in its state table, with median figures drawn from ACS data where available. The OEWS program covers nearly all U.S. wage and salary workers across private and public sectors.
Pro Tip: When negotiating a salary or evaluating a job offer, always ask which benchmark the employer used. If they cite a mean, ask for the median for your specific occupation and metro area — those two numbers can differ by $15,000 or more in high-wage cities.Average salary by state: full 50-state data table
The table below covers all 50 states plus the District of Columbia. Mean annual wage figures come from the BLS OEWS program; median full-time salary figures are drawn from ACS and BLS compilations. Dataset year: 2023–2024. For the interactive version with occupation filters and a CSV download, visit Salary Atlas's state salary data page.
| State | Mean Annual Wage (BLS OEWS) | Median Full-Time Salary |
|---|---|---|
| Alabama | — | ~$52,000 |
| Arkansas | — | ~$50,500 |
| District of Columbia | — | $102,970 |
| Florida | — | ~$55,000 |
| Indiana | — | ~$55,000 |
| Iowa | — | ~$54,000 |
| Kansas | $57,990 | ~$54,500 |
| Kentucky | $55,680 | ~$52,000 |
| Louisiana | $55,230 | ~$51,000 |
| Maine | $57,490 | ~$54,000 |
| Maryland | $76,540 | $74,982 |
| Massachusetts | $82,280 | $79,113 |
| Michigan | $61,230 | ~$57,000 |
| Minnesota | $68,450 | ~$65,000 |
| Mississippi | $51,960 | $50,120 |
| Missouri | $58,690 | ~$55,000 |
| Montana | $54,730 | ~$51,500 |
| Nebraska | $57,640 | ~$54,000 |
| Nevada | $59,800 | ~$56,000 |
| New Hampshire | $65,120 | — |
| New Jersey | $77,860 | $74,164 |
| New Mexico | $55,910 | ~$52,500 |
| New York | $80,150 | ~$72,000 |
| North Carolina | $60,870 | ~$57,000 |
| North Dakota | $59,210 | ~$56,000 |
| Ohio | $60,580 | ~$57,000 |
| Oklahoma | $54,870 | ~$51,500 |
| Oregon | $65,730 | — |
| Pennsylvania | $64,870 | ~$61,000 |
| Rhode Island | $66,940 | — |
| South Carolina | $56,280 | — |
| South Dakota | $52,960 | ~$50,500 |
| Tennessee | $57,400 | ~$54,000 |
| Texas | $64,530 | — |
| Utah | $62,750 | ~$59,000 |
| Vermont | $59,560 | ~$56,000 |
| Virginia | $73,490 | ~$69,000 |
| Washington | $79,340 | $76,323 |
| West Virginia | $51,840 | ~$49,000 |
| Wisconsin | $60,940 | ~$57,500 |
| Wyoming | $57,010 | ~$54,000 |
- Mean annual wage figures are sourced from the BLS OEWS national and state estimates; dataset year 2023.
- Median full-time salary figures marked with exact values come from the Visual Capitalist ACS/BLS compilation; cells showing "~" are rounded estimates based on cross-referenced BLS and ACS data.
- Part-time workers are excluded from full-time median calculations. OEWS mean figures include all wage and salary workers in covered employment.
- Last updated: 2024 data cycle (BLS OEWS May 2023 release, ACS 2023 one-year estimates).
Which states pay the most and least?
The top 5 jurisdictions by median salary
- Massachusetts — ($79,113) — Boston's biotech corridor, financial services firms, and research universities like MIT and Harvard pull the median well above the national figure. The BLS OEWS data confirms Massachusetts consistently ranks among the top two or three states.
The bottom 5 states by median salary
- West Virginia (~$49,000) — Limited industry diversification and an economy still transitioning away from coal keep wages at the lower end.
- Mississippi ($50,120) — The lowest median full-time salary of any state, driven by an agricultural and service-sector economy with limited high-wage industry concentration.
- Arkansas (~$50,500) — Retail and logistics dominate, with Walmart's headquarters providing some high-wage anchor jobs but not enough to lift the statewide median significantly.
- South Dakota (~$50,500) — A small population and an economy built around agriculture, tourism, and financial services (credit card processing) keeps median wages low despite low unemployment.
- Louisiana (~$51,000) — Energy sector wages are high, but they serve a narrow slice of the workforce. The broader economy, heavily weighted toward hospitality and retail, pulls the median down.
What drives the regional divide?
States with concentrated tech, finance, and federal government employment consistently rank highest. Economic research shows this pattern holds because those industries pay above the national average across nearly every occupation level, not just at the top. A database administrator in Washington state earns materially more than the same role in Mississippi, not because the job is different but because the surrounding labor market is.

The South's lower medians reflect a mix of industry structure, lower unionization rates, and historically lower costs of living that have suppressed nominal wage growth. The interior West and Great Plains states cluster in the middle, with agriculture and energy creating pockets of higher pay within otherwise modest wage environments.
How to compare purchasing power across states
A $75,000 salary in San Francisco and a $55,000 salary in Austin are not as far apart as they look on paper. The Bureau of Economic Analysis recommends adjusting nominal wages by regional price parities (RPPs) to compare real purchasing power across states. Without that adjustment, you can easily accept a "raise" that actually leaves you worse off.

Here is how the math plays out in practice:
| Scenario | Nominal Salary | Estimated COL Index | Purchasing Power Equivalent |
|---|---|---|---|
| San Francisco, CA | $75,000 | ~170 (vs. national 100) | ~$44,100 in national dollars |
| Austin, TX | $55,000 | ~105 | ~$52,400 in national dollars |
| Columbus, OH | $52,000 | ~90 | ~$57,800 in national dollars |
High nominal wages in places like New York or California often buy less than mid-level wages in lower-cost states, a point analysts consistently flag when comparing state salary data. That does not mean high-wage states are bad choices. Career trajectory, professional networks, and industry access matter too. But the nominal number alone is not the full story.
For healthcare professionals weighing a move, nursing salary insights by state show how dramatically purchasing power shifts even within a single occupation.
Should you move for higher pay? A practical checklist
Relocating for a salary bump sounds straightforward. It rarely is. Work through these factors before you decide.
- Calculate the COL-adjusted salary difference. Use the BEA's regional price parities or a cost-of-living calculator to convert both salaries to a common baseline. A $15,000 nominal raise can shrink to $3,000 in real terms.
- Model your state income tax exposure. Texas and Florida have no state income tax; California and New York top out above 13%. On a $100,000 salary, that gap is real money.
- Price housing in both markets. Median home prices and rental rates vary more than wages do. A mortgage payment in Phoenix versus Seattle can differ by $1,500 a month on comparable homes.
- Assess career pipeline, not just current pay. A lower starting salary in a city with a deep industry cluster (Boston for biotech, Seattle for tech) can outperform a higher starting salary in a market with limited upward mobility.
- Factor in relocation costs. A cross-country move typically runs $4,000–$10,000 for a household. That comes out of year-one earnings.
- Ask the employer about total compensation. Base salary is one line item. Health insurance quality, 401(k) match, equity, remote-work flexibility, and annual raise cadence all affect the real value of an offer.
- Consider family and housing stability. School quality, proximity to family, and community ties have real economic value even when they do not show up in a salary comparison.
Pro Tip: When evaluating a job offer in a new state, ask the recruiter for the salary band for your role and the typical annual merit increase percentage. A $65,000 offer with 5% annual raises beats a $70,000 offer with 2% raises within four years. For a deeper framework on evaluating total compensation packages, this guide to evaluating nurse practitioner job offers applies broadly across professions.
How Salary Atlas compiled these numbers
Transparency about sources is not optional when the data drives career decisions. Here is exactly what went into this article.
Primary data sources:- BLS Occupational Employment and Wage Statistics (OEWS): The mean annual wage column draws from the BLS OEWS May 2023 state and national estimates. OEWS surveys approximately 1.1 million business establishments and covers nearly all U.S. wage and salary workers in non-farm employment.
- U.S. Census Bureau American Community Survey (ACS): Median full-time salary figures use the ACS 2023 one-year estimates, which define "full-time, year-round" workers as those who worked 35 or more hours per week for 50 or more weeks.
- OEWS data reflects wages at the time of the survey, not current market rates. The May 2023 release is the most recent complete dataset as of this publication.
- Part-time workers are excluded from the ACS full-time median but included in OEWS mean calculations, which can make the mean appear lower than the full-time median in some states.
- Metro-area blending: OEWS state figures average across all metro and non-metro areas within a state, which can mask large within-state variation (e.g., Seattle vs. rural eastern Washington).
- The BLS national median annual wage for all workers was $48,060 in 2023, which is lower than the $61,702 full-time median because it includes part-time workers. Both figures are valid; they measure different populations.
Key Takeaways
The U.S. median full-time salary is $61,702. The BLS all-worker median, which includes part-time workers, is $48,060.
| Biggest regional split | DC ($102,970) and Massachusetts ($79,113, Visual Capitalist compilation of ACS/BLS data) lead; Mississippi ($50,120, Visual Capitalist compilation of ACS/BLS data) and West Virginia (~$49,000, Visual Capitalist compilation of ACS/BLS data) sit at the bottom. |
|---|---|
| Industry concentration drives wages | Tech, finance, and federal government concentration explains why top-ranked states consistently outpace the national median. |
| Adjust for cost of living | A $55,000 salary in Austin can carry more purchasing power than $75,000 in San Francisco after COL adjustment. |
| Salary Atlas state data | Salary Atlas publishes free, BLS-sourced mean and median figures by state with annual updates and no paywall. |
The real story behind state salary rankings
The salary-by-state rankings get published every year, and every year the same states sit at the top and the same ones sit at the bottom. That consistency is worth examining, because it suggests the gap is structural, not accidental.
What most salary comparisons miss is that the top-ranked states are not just paying more for the same work. They have fundamentally different industry mixes. Massachusetts does not have a high median because employers there are generous. It has a high median because a disproportionate share of its workforce works in biotech, financial services, and higher education, three sectors that pay above average at nearly every level. A receptionist in Boston earns more than a receptionist in Jackson, Mississippi, not because the job is harder but because the surrounding labor market sets a higher floor.
The implication for job seekers is practical: if you want to earn more without changing careers, moving to a state with a stronger industry cluster in your field will do more for your salary than almost any other single move. A teacher in Massachusetts earns more than a teacher in Arkansas. A judge in DC earns more than a judge in Montana. The occupation is the same; the market is different.
The cost-of-living adjustment complicates this, but it does not erase it. Even after adjusting for purchasing power, high-wage states tend to offer better career trajectories, deeper professional networks, and more frequent job openings in competitive fields. The salary premium is real. Whether it is worth the cost of living is a personal calculation, not a universal answer.
Salary Atlas publishes this data without paywalls because the people who most need it, those making career or relocation decisions without a financial advisor, deserve the same access as anyone else. Every figure links back to its BLS or Census source so you can verify it yourself.
Free state salary tools from Salary Atlas
Salary Atlas gives you direct access to BLS-sourced wage data for every U.S. state, with no signup required and no figures behind a paywall. The state salary page lets you compare mean and median wages across all 50 states and DC, filter by occupation, and download the full dataset as a CSV.
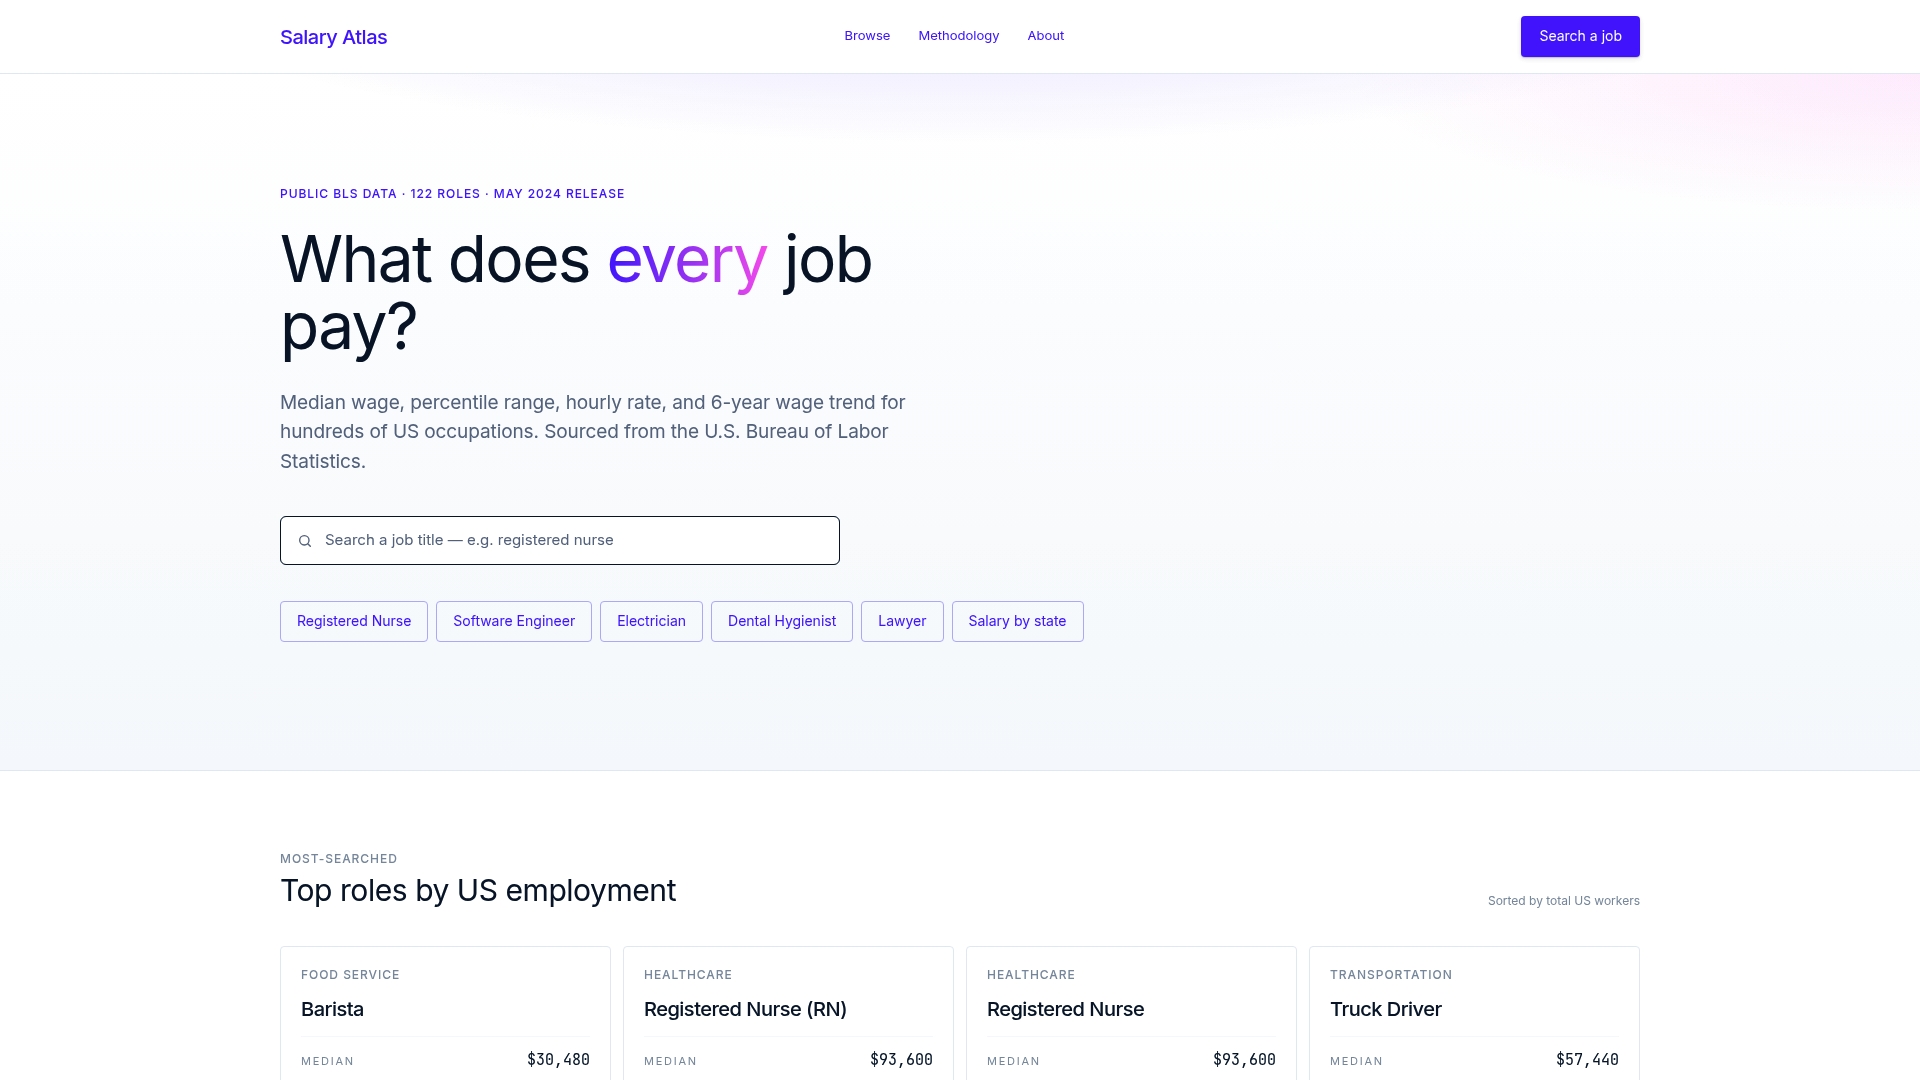
If you are researching a specific role, the job-title pages show how pay for that occupation varies state by state, with six-year trend data and percentile breakdowns. Whether you are a job seeker benchmarking an offer, an HR professional setting a salary band, or a researcher pulling wage data, the tools work the same way: transparent figures, primary sources, no cost.
Start with the Salary Atlas state salary page for the full state comparison, or search by job title at salary-atlas.com to see how your occupation's pay varies across the country.
Useful sources and further reading
These are the primary datasets behind the figures in this article. Each one lets you go deeper than any summary can.
- U.S. Census Bureau ACS Table S1901 — Household income and earnings data by state from the American Community Survey. The source for full-time, year-round median earnings used in this article.
- Bureau of Economic Analysis (BEA) — Regional price parities and personal income data by state. Use the BEA's RPP tables to convert nominal wages to purchasing-power equivalents.
- U.S. Department of Labor — State Minimum Wage Laws — State-by-state minimum wage floors, which set the lower bound for wage distributions and help explain why some state medians cluster near the bottom.
FAQ
The national median full-time salary is approximately $61,702, with state figures ranging from $50,120 in Mississippi to $102,970 in the District of Columbia. The full 50-state breakdown is in the table above, sourced from ACS/BLS 2023 data.
Which states have the highest average salaries?
The District of Columbia ($102,970), Massachusetts ($79,113, Visual Capitalist compilation of ACS/BLS data), Washington ($76,323, Visual Capitalist compilation of ACS/BLS data), Maryland ($74,982, Visual Capitalist compilation of ACS/BLS data), and New Jersey ($74,164, Visual Capitalist compilation of ACS/BLS data) consistently rank at the top, driven by concentrations of tech, finance, federal government, and biotech employment.
Why does the median salary differ from the mean salary?
The mean adds all wages and divides by the number of workers, so a small number of very high earners pulls it up. The median is the midpoint wage where half of workers earn more and half earn less, making it a better reflection of what a typical worker actually takes home.
Does a higher state salary always mean more purchasing power?
Not necessarily. A $75,000 salary in San Francisco has less real purchasing power than a $55,000 salary in Austin after adjusting for cost of living. The BEA's regional price parities are the standard tool for making that comparison.
Where does Salary Atlas get its state wage data?
Salary Atlas sources mean annual wage figures from the BLS OEWS program and median full-time salary figures from the U.S. Census Bureau's ACS. All figures are updated annually following each BLS OEWS release, and every number links back to its primary source.