2.8% COLA Isn't Enough: HR Should Anchor Base Pay to BLS Market Data
For HR and compensation teams: anchor salary bands to BLS market pay, use living-cost checks only for relocations or retention risk, and document each...
By the Salary Atlas editorial team · Published

Cost of labor, not cost of living, should set your base pay and salary structures. Cost of living earns a seat at the table only in specific situations: relocations, temporary hardship adjustments, or retention risk in high-cost metros. If you need current numbers, start with the Bureau of Labor Statistics for wage benchmarks, the Social Security Administration for CPI-based cost adjustments, the MIT Living Wage Calculator for household costs, and Salary Atlas for BLS-sourced pay data by state and role.
TL;DR:
- Market pay data from sources like BLS protects budgets and ensures internal equity, while living-cost adjustments mainly apply to relocations or high-cost metro reviews.
- Housing costs constitute about a third of household expenses, making location-based differentials more critical for high-cost housing markets than for transportation-focused regions.
- Combining market wages with geographic living-cost checks simplifies pay decisions and helps avoid reactive raises driven by poorly defined policies.
- Using BLS data for remote and hybrid roles allows for location-adjusted pay models, but inconsistent application can trigger pay equity disputes if not clearly documented.
- Regularly updating benchmarks and policies, with documented data sources and review schedules, safeguards against audit challenges and pay misalignment.
Table of Contents
- Why Cost of Labor and Cost of Living Diverge in Compensation Strategy
- What Do Cost of Labor and Cost of Living Actually Measure?
- How Should HR Combine Both Metrics When Setting Pay?
- Which Pay Policy Fits Your Organization?
- What Data Sources Should HR Use to Calculate Pay Adjustments?
- How Should Remote and Hybrid Roles Be Paid?
- The Bottom Line for Compensation Teams
- How Salary Atlas Approaches BLS-Sourced Pay Data
- Get Market-Rate and Living-Cost Data Without the Guesswork
- Sources
- FAQ
Why Cost of Labor and Cost of Living Diverge in Compensation Strategy
Market pay sets your budget ceiling. It's what competitors pay for the same role in the same labor market, and it's the number that should anchor your salary bands, internal equity reviews, and hiring forecasts. Living costs work differently. They measure what an employee needs to spend to maintain a given standard of living, and they swing far more by geography than wages typically do.
That gap creates real friction. An employee in a high-cost city can be paid at or above market rate for their role and still feel squeezed, because housing alone often eats close to a third of a household budget. When perceived pay doesn't cover perceived costs, turnover risk climbs, even at competitive market wages.
There's also a feedback loop worth watching. Rising living costs push workers to demand higher wages, employers raise pay to retain talent, and that additional labor cost eventually shows up in prices, which pushes living costs up again. The Social Security Administration's 2.8% COLA for 2026, tied directly to CPI-W data, is a clean example of how formalized cost-of-living tracking works when an institution needs to adjust income for inflation.
Here's what this means for your planning:
- Market pay data protects your budget and internal equity.
- Living-cost blind spots drive attrition even when salaries look competitive on paper.
- Ignoring the wage-price feedback loop leads to reactive, unplanned raises instead of a policy.
What Do Cost of Labor and Cost of Living Actually Measure?
The two metrics answer different questions, and mixing them up is the single most common error in pay-setting decisions.
- Cost of labor is an employer-side, market-driven number. It reflects what employers in a given labor market pay for a specific role, factoring in wages, payroll taxes, benefits, and total employment cost. The Bureau of Labor Statistics' Occupational Employment and Wage Statistics program is the primary US source, along with private market surveys.
- Cost of living is a household-side number. It tracks what a person or family needs to spend on housing, food, transportation, and healthcare to maintain a given standard of living in a specific location. The Consumer Price Index and tools like the MIT Living Wage Calculator are the standard references.
- The reporting differs too. BLS wage data is reported by occupation and geographic area, updated annually. Cost-of-living tools like the MIT Living Wage Calculator break down county-level estimates by family size, showing how food and medical costs alone can shift a household's required income by thousands of dollars a year.
How Should HR Combine Both Metrics When Setting Pay?
Most compensation teams get this backward. They start with a candidate's cost of living and work up to a number, instead of starting with market pay and checking it against living costs. Reverse that order and the framework gets much simpler.
- Evaluate market value first. Pull BLS/OES wage data or a current salary benchmarking tool for the role and location. This is your baseline, not your final number.
- Check living costs second. Run the offer location through the MIT Living Wage Calculator or a comparable tool, especially for high-cost metros or international relocations.
- Apply your policy rule. Decide in advance whether living-cost gaps trigger a differential, a one-time relocation stipend, or no adjustment at all.
Here's the arithmetic in practice: a role benchmarks at $75,000 nationally.
Pro Tip: Document every living-cost adjustment with the data source and date it was pulled. When someone challenges a pay decision eighteen months later, "we used MIT's calculator on this date" is a far stronger answer than "it felt fair at the time."Which Pay Policy Fits Your Organization?
There's no single right answer here, but there is a wrong one: applying a blanket cost-of-living adjustment to every employee regardless of role criticality or actual market pressure. That approach burns budget on people who were never at flight risk and underpays the ones who are.
Three policy structures dominate in practice:
- National pay scale with no geographic differential. Simple to administer, but risks overpaying in low-cost markets and underpaying in high-cost ones, which erodes retention where you need it most.
- Location-based salary bands. Sets different pay ranges by metro or cost-of-living tier, using BLS wage data as the market anchor and a living-cost index to size the tier gaps. This is the most common approach among midsize and large employers.
- Role-based exceptions with targeted differentials. Keeps a single national structure but layers in living-cost or retention-risk adjustments only for specific roles or locations under documented criteria.
The most common red flag: reactive raises granted case by case with no written rule behind them. That's how pay equity complaints start.
What Data Sources Should HR Use to Calculate Pay Adjustments?
Four sources cover almost every situation you'll face:
- CPI and SSA COLA data, show how cost-of-living adjustments get calculated at the federal level. The 2026 COLA of 2.8% is derived from third-quarter CPI-W comparisons, and you can mirror that same method for internal real-wage checks.
- MIT's Living Wage Calculator, and similar tools break down household costs by county and family size, useful for relocation and hardship reviews.
How Should Remote and Hybrid Roles Be Paid?
Remote work broke the old logic that pay should track the employee's home address to the dollar. Three models dominate now, each with tradeoffs:
- National flat rate. One salary band regardless of location. Simple, but risks overpaying in low-cost areas and losing candidates in high-cost ones.
- Location-adjusted banding. Pay scales by geographic tier, often the most defensible approach because it uses actual BLS wage data by area rather than guesswork.
- Role-criticality exceptions. A flat national rate with carve-outs for scarce skills, regardless of where the person lives.
The Bottom Line for Compensation Teams
Base pay follows the market. Cost of labor from BLS/OES data sets your salary bands and budget; cost of living only comes into play for relocations, hardship reviews, or targeted retention decisions in high-cost metros.
Three things to do this week:
- Pull current BLS/OES benchmarks for your highest-turnover roles and confirm your bands are still market-aligned.
- Run a living-cost check through MIT's calculator for any role with active relocation or remote-hire pressure.
- Write your differential policy down, including the data source, the calculation method, and the review cadence, so it survives an audit or a challenge.
How Salary Atlas Approaches BLS-Sourced Pay Data
Every figure published traces back to a Bureau of Labor Statistics source, and that traceability matters more in compensation work than in almost any other HR function. When you're defending a pay decision to a director, a candidate, or an auditor, "here's the BLS series this number came from" beats an unsourced average every time.
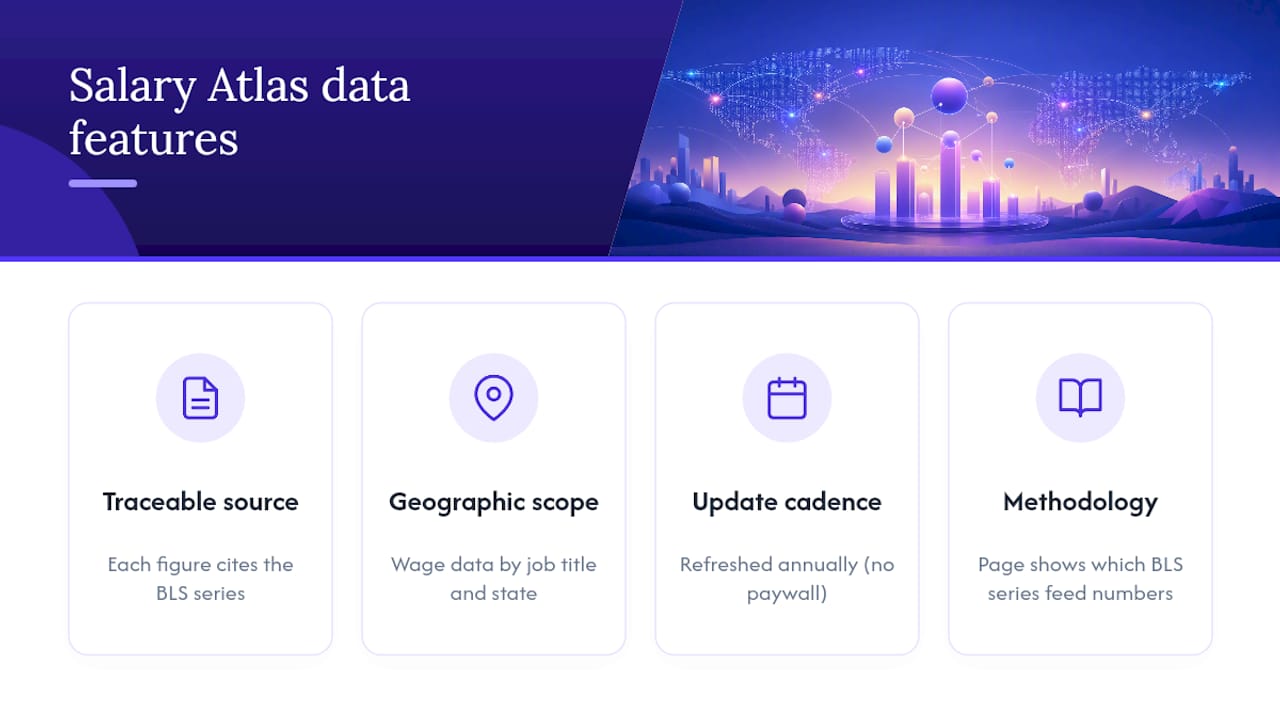
The frameworks above, market value first, living-cost check second, policy rule third, all lean on having a clean market-pay number to start from. A useful resource fills that gap with BLS-sourced wage data by job title and state, refreshed annually, with no paywall between HR and the underlying figures. If you want to see how the sourcing works before you rely on it for a real pay decision, the methodology page breaks down exactly which BLS series feed each number and how often they update.
Our own analysis on the wage-versus-cost-of-living gap walks through why a 2.8% COLA rarely closes the affordability gap for workers in high-cost metros, using the same CPI method described earlier in this piece.
, Joelen Zyoktova
Get Market-Rate and Living-Cost Data Without the Guesswork
Running the framework above manually means juggling BLS tables, a living-wage calculator, and whatever spreadsheet your team inherited three reorganizations ago. Various platforms cut that down to one stop: BLS-sourced salary data by job title, state, and experience level, with figures linked back to their original sources to help defend compensation reviews without extra digging.
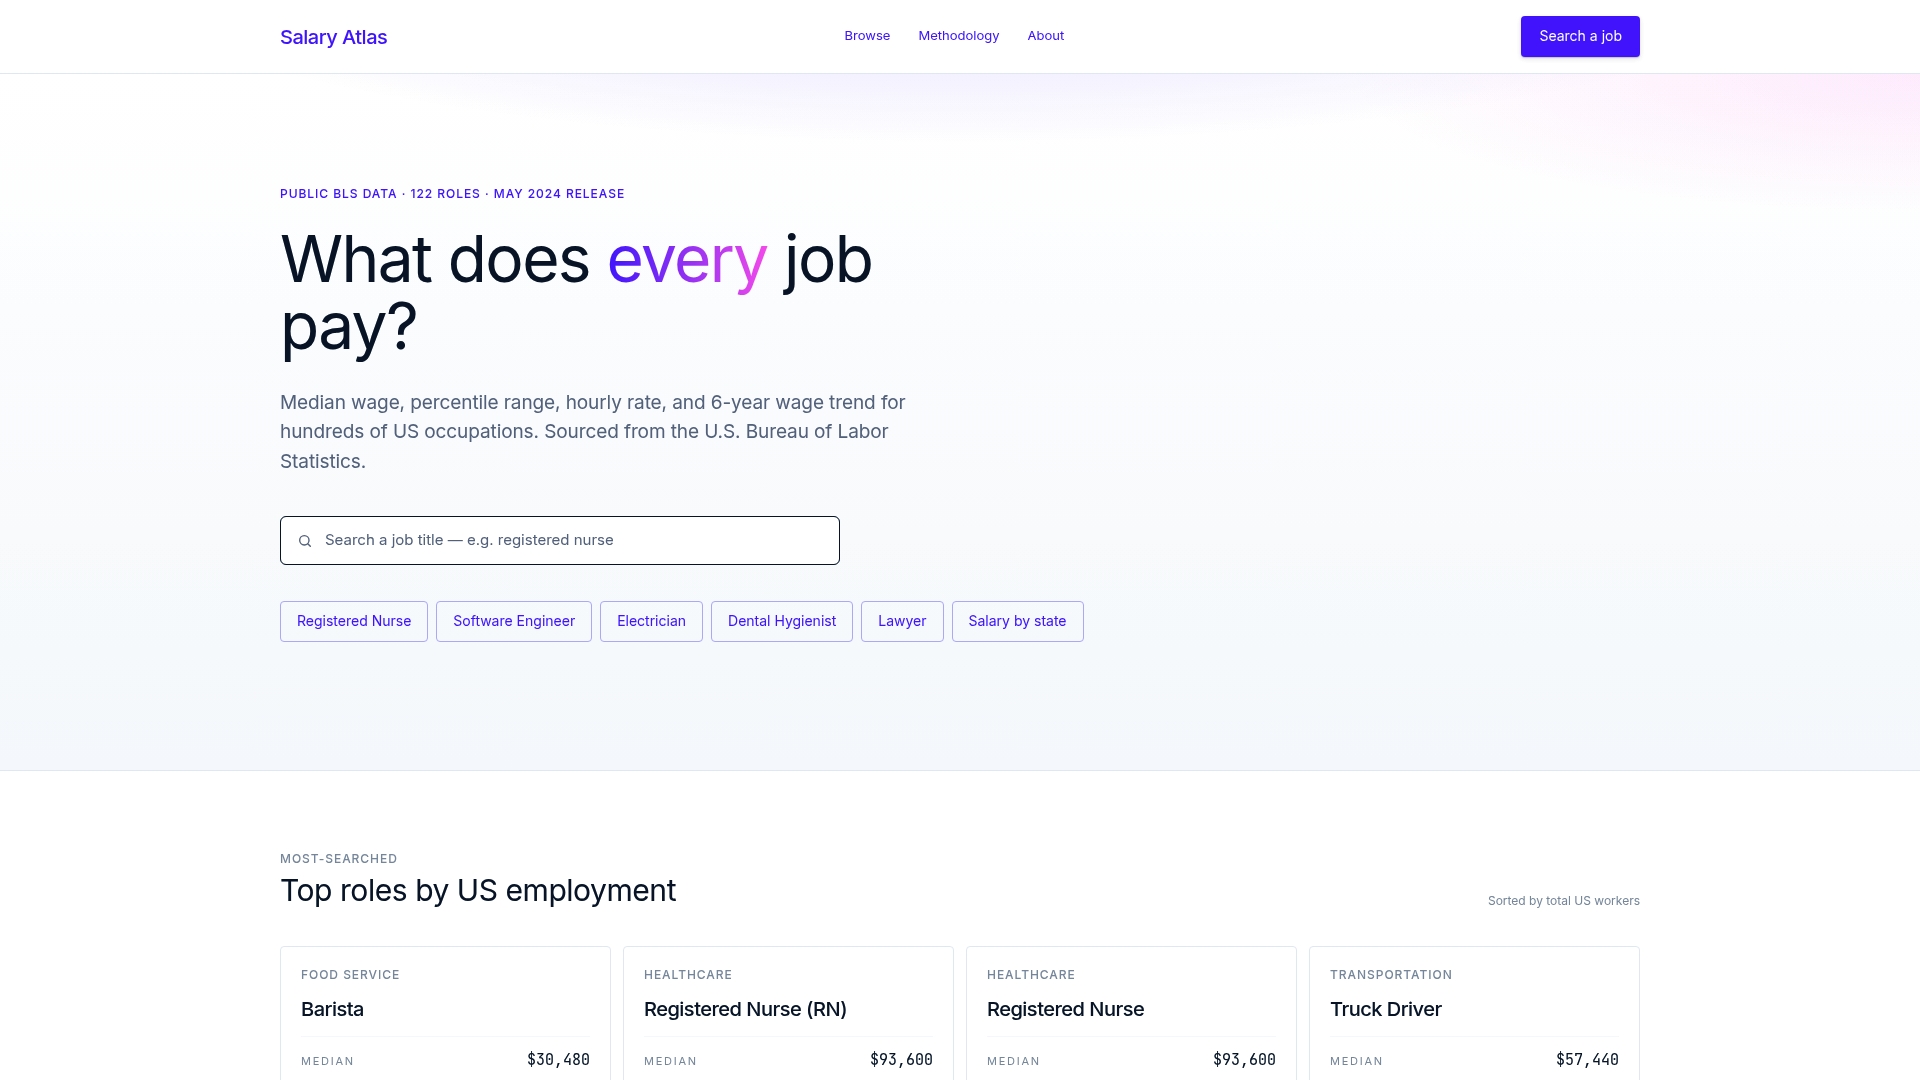
That sourcing matters most in exactly the situations this article covers: benchmarking a role before a relocation adjustment, checking whether your bands have drifted from market, or backing up a hiring manager who thinks the offer is too low. Start with the salary data by state page to pull current BLS/OES benchmarks for your open roles, or check a specific role like the data analyst salary breakdown to see the format before you build it into your own pay review process.
Sources
- Social Security Administration, 2026 COLA factsheet
- MIT Living Wage Calculator
- Bankrate, cost of living calculator and methodology
- Wilson Group, Cost of Living vs Cost of Labor
- Indeed, Cost of Living vs. Cost of Labor: What's the Difference?
FAQ
Is $20 an Hour a Livable Wage?
It depends entirely on location and household size. In a low-cost county, a wage that covers basic expenses for a single adult may fall well short of covering housing, food, and healthcare for a family of four in most metro areas, according to the MIT Living Wage Calculator.
Is It Cheaper to Retain an Employee or Hire a New One?
Retaining an existing employee is almost always cheaper once you factor in recruiting, onboarding, and lost productivity during a vacancy, which is a major reason cost-of-living pressure on retention deserves attention even when cost-of-labor data alone doesn't justify a raise.
How Much Is a 3% Cost-of-Living Raise?
Whether that keeps pace with actual inflation depends on the CPI change over the same period; the 2026 SSA COLA of 2.8% is a useful benchmark for comparison.
What Percentage of Total Costs Should Labor Represent?
This varies heavily by industry, so there's no single target percentage that applies across the board. Instead of chasing a fixed ratio, benchmark your labor costs against BLS wage data for your specific occupations and region, then track the trend over time rather than a static number.
Should Remote Employees Be Paid Based on Where They Live?
Many employers use location-adjusted banding for remote roles, tying pay to BLS wage data for the employee's region rather than a flat national rate, though role-criticality exceptions are common for scarce skills regardless of location.
Recommended
Occupation wage figures on Salary Atlas come from the U.S. Bureau of Labor Statistics. Figures in this article that are not linked to a source are estimates. See our methodology.