Compa Ratio: The Formula HR Teams Use to Judge Fair Pay
Discover how to calculate compa ratio, the essential formula HR teams use to ensure fair pay and assess employee compensation effectively.
By the Salary Atlas editorial team · Published

Compa ratio equals an employee's base pay divided by the salary midpoint. Multiply by 100 and you get a percentage: 100% means the person sits exactly at the midpoint. Anything under 100% means they're paid below target; anything over 100% means they're paid above it.
The math is simple. The judgment calls around it are not. A 78% compa ratio might indicate a brand new hire climbing the range as planned, or it might mean a ten-year veteran who's been quietly underpaid. The midpoint itself, whether pulled from an internal band or sourced from data like the Bureau of Labor Statistics figures on Salary Atlas, determines whether that number means anything at all.Key Takeaways
Compa ratio works because it turns a single pay decision into a measurable, comparable number, but only when the midpoint behind it is current and well-sourced.
| Point | Details |
|---|---|
| Formula stays simple | Divide annual base salary by the salary midpoint, then multiply by 100 to get a percentage. |
| Watch the healthy band | Most policies target 90% to 110%, with 80% to 120% as the wider acceptable range. |
| Pick the right ratio type | Use individual for reviews, group for budgeting, and average only when headcount matters more than dollars. |
| Midpoint quality drives accuracy | Stale surveys or mismatched job titles produce a number that looks precise but isn't. |
| Pair with equity analysis | Compa ratio alone doesn't prove fair pay; run it alongside demographic and job-context review. |
Table of Contents
- How to Calculate Compa Ratio Step by Step
- Individual, Group, and Average Compa Ratios: What's the Difference
- What Counts as a Good Compa Ratio?
- How HR Applies Compa Ratio to Real Pay Decisions
- What Compa Ratio Doesn't Tell You
- A Worked Compa Ratio Calculation Example
- Why Midpoint Data Quality Determines Whether Compa Ratio Means Anything
- How Compa Ratio Varies Across Industries and Job Levels
- Does Compa Ratio Affect Employee Retention?
- How Compa Ratio Has Evolved as a Compensation Metric
- Legal and Compliance Considerations for Compa Ratio Usage
- Get Reliable Midpoint Data for Your Compa Ratio Analysis
- Why Compa Ratio Deserves More Respect Than It Gets
- Sources
- FAQ
How to Calculate Compa Ratio Step by Step
The individual compa ratio formula is: annual base salary ÷ salary midpoint × 100. Both numbers need to be in the same units and same time frame, which trips up more spreadsheets than you'd expect.
Here's the sequence to run for one employee:
- Confirm the employee's annual base salary. If they're paid hourly, multiply hourly rate by 2,080 (40 hours × 52 weeks) to annualize it.
- Adjust for part-time status. A person working 0.6 FTE should be compared against a midpoint scaled to their FTE, or their pay should be grossed up to full-time equivalent before comparing. Pick one method and use it consistently.
- Pull the salary midpoint for that role and level. This should come from either your internal pay band or a market source.
- Divide salary by midpoint, multiply by 100.
- Group compa ratio = sum of all actual salaries ÷ sum of all midpoints for that group, times 100.
- Average compa ratio = the mean of each individual's compa ratio, added up and divided by headcount.
Individual, Group, and Average Compa Ratios: What's the Difference
These three numbers get used interchangeably in casual conversation, and that's a mistake. They answer different questions.
- Individual compa ratio tells you where one person sits relative to their specific midpoint. Use it in performance reviews and one-on-one pay conversations.
- Group compa ratio weights the calculation by salary dollars, so it reflects total budget exposure. Use it for department-level budget planning and to check whether policy matches practice across a function.
- Average compa ratio treats every employee equally regardless of pay level, which can mask the fact that your highest earners are the ones pulling the number up or down.
What Counts as a Good Compa Ratio?
Many employers treat a certain range around 100% as the normal operating range, with a tighter band often used as the actual policy target in many compensation structures. A compa ratio of 95%, for context, means someone is paid 5% below the midpoint. That's typically fine and unremarkable, especially for someone newer to the role.
Job level, tenure, and how tight the labor market is for that role all shift where a ratio should reasonably fall. A brand new hire landing at 85% is expected.
Here's how most HR teams translate the number into action:
- Below 80%: Flag immediately. Likely pay compression, retention risk, or a stale midpoint.
- 80% to 90%: Review case by case. Often fine for newer employees; worth a look for tenured staff.
- 90% to 110%: The healthy zone. No action needed for most roles.
- 110% to 120%: Usually a strong performer near range max. Watch for promotion readiness.
- Above 120%: Investigate. Either the role has outgrown its band or the midpoint itself is outdated.
How HR Applies Compa Ratio to Real Pay Decisions
Compa ratio earns its keep in four recurring moments: merit cycles, new-hire offers, promotion decisions, and annual budget planning.
- Merit increases. Employees below 90% often get priority for larger increases, assuming performance supports it. Someone already at 115% may get a smaller percentage bump even with a strong review, simply because they're already well-compensated relative to the role.
- New-hire targets. Recruiters use compa ratio to sanity-check offers before they go out, avoiding a scenario where a new hire lands 10 points above a tenured peer in the same job.
- Promotion decisions. A promotion often resets someone's compa ratio lower, since they're now measured against a higher midpoint. That's normal and worth explaining upfront.
- Budget allocation. Group compa ratios roll up into departmental budget requests, showing finance where merit dollars need to go first.
What Compa Ratio Doesn't Tell You
A compa ratio is only as good as its midpoint. A stale survey, a mismatched job title, or a midpoint that ignores geographic pay differences will produce a number that looks precise and means very little.
Base-salary compa ratio also leaves out bonuses, commissions, and equity. When variable pay is a meaningful part of someone's package, calculate a separate total-compensation ratio alongside the base figure rather than letting one number carry both jobs.
Small teams and brand-new roles create their own problem: not enough data points to trust the average, and no reliable external benchmark yet. Treat compa ratio as one input among several, never the sole basis for a pay decision, and always pair it with demographic and job-context analysis before calling something a pay-equity issue.
A Worked Compa Ratio Calculation Example
Take an employee earning $68,000 with a role midpoint of $72,000.
- Divide $68,000 by $72,000, giving 0.944.
- Multiply by 100: a 94.4% compa ratio. That's inside the healthy 90 to 110% band, no action needed.
- Group compa ratio: $340,000 ÷ $360,000 × 100 = 94.4%.
- If the average of the five individual ratios comes out to 92%, that gap tells you dollars and headcount aren't distributed evenly across the team, even though both numbers look similar at a glance.
Why Midpoint Data Quality Determines Whether Compa Ratio Means Anything
Every compa ratio is only as trustworthy as the midpoint behind it. Salary Atlas sources its figures from BLS and OEWS data, refreshes them annually, and links every number back to its original source, which gives compensation teams something they can actually cite in an audit.
- Use published wage percentiles as a documented, defensible starting midpoint when internal bands are outdated.
- Cross-check role titles carefully. Occupational codes don't always map cleanly to internal job titles.
- Record your midpoint source directly in your compensation file for future audits.
How Compa Ratio Varies Across Industries and Job Levels
Compa ratio patterns shift depending on where you sit in an org chart and what industry you're in.
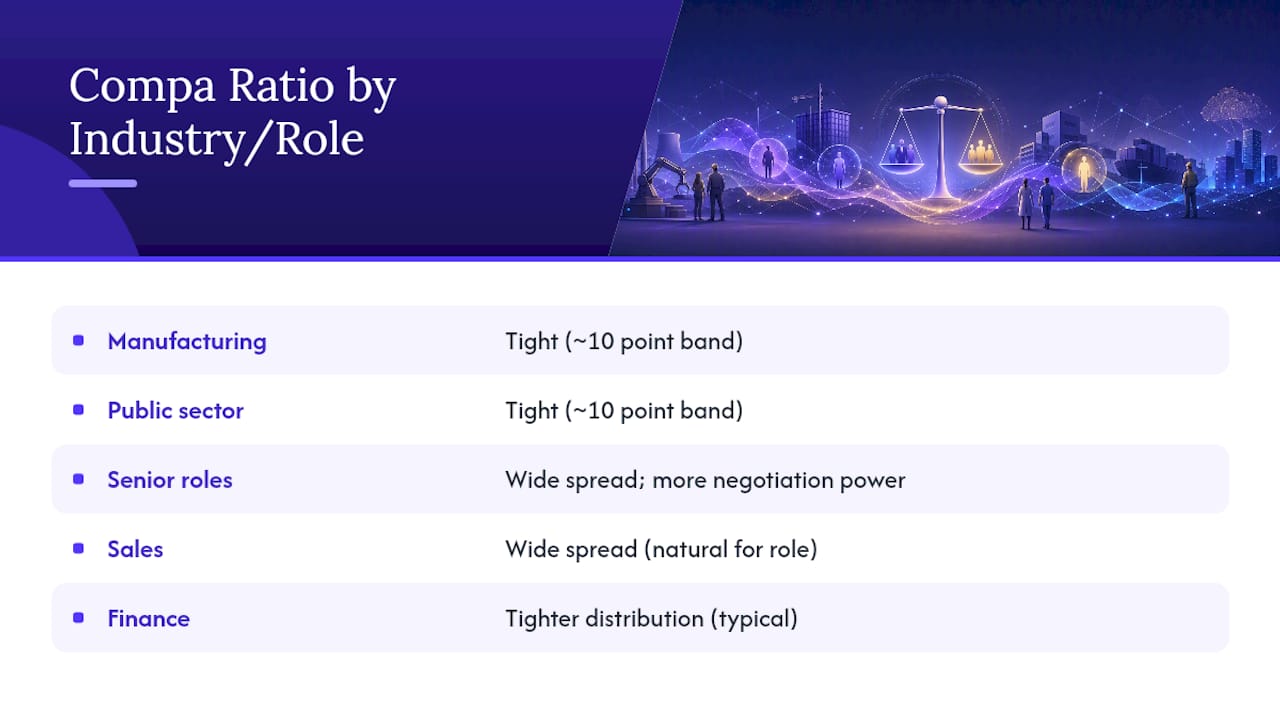
Senior technical and leadership roles show far more spread.
Industries with strong union representation or standardized pay scales, like manufacturing or public sector work, tend to show the tightest compa ratio distributions of all, sometimes clustering within a 10 point band across an entire department.
None of this means one pattern is right and another is wrong. A tight distribution signals consistency; a wide one signals a market where individual negotiation power matters more than the band. What matters is knowing which pattern your industry and role type should show, so you're not comparing a sales team's naturally wide spread against a finance team's naturally tight one and calling the difference a problem.
Does Compa Ratio Affect Employee Retention?
Pay dissatisfaction rarely shows up as a direct complaint. It shows up as declining engagement, followed by a resignation that catches a manager off guard.

The relationship isn't purely mechanical, though. Compa ratio measures one input into retention, not the whole picture, but it's a measurable one, which makes it useful precisely because it doesn't depend on a manager's read of team morale.
That's the moment group compa ratio becomes more valuable than any single person's number, because it flags a systemic gap before it shows up as a wave of resignations. Smart compensation teams pull group compa ratios by department every review cycle specifically to catch this pattern early, rather than reacting after exit interviews start repeating the same complaint.
How Compa Ratio Has Evolved as a Compensation Metric
Compa ratio has been a fixture of compensation work for decades, built for an era when pay bands were static, updated once a year at most, and market data arrived through slow, expensive salary surveys. That origin still shapes how the metric gets used today, sometimes awkwardly.
What's changed is the speed and transparency of the data feeding it. Pay bands used to move once annually; now, in competitive fields, some companies adjust ranges quarterly in response to real-time hiring data. Publicly available wage data, refreshed on a defined annual cycle and tied to explicit source citations, has made it far easier for a mid-sized company to build a credible midpoint without paying for a proprietary survey.
The bigger shift is philosophical. Compa ratio used to function mostly as an internal budgeting tool, rarely shared with the employees it described. Pay transparency laws in a growing number of states have pushed compa ratio, or at least the pay ranges behind it, into the open. Employees increasingly expect to understand where they land in a band and why, which means the metric now does double duty: internal budgeting tool and external communication tool. Best practice has responded by recommending recalculation at least annually, and immediately after any significant pay event like a promotion or a new hire, rather than letting a number sit stale for a full review cycle.
Legal and Compliance Considerations for Compa Ratio Usage
Compa ratio itself isn't a legal requirement in any U.S. jurisdiction, but the pay-equity questions it surfaces absolutely are. Federal law under the Equal Pay Act and Title VII prohibits pay discrimination based on protected characteristics, and a persistent, unexplained compa ratio gap correlated with gender or race is exactly the kind of pattern regulators and plaintiffs' attorneys look for.
A growing list of states now require pay range disclosure in job postings, which means the midpoint behind your compa ratio calculations may need to hold up to public scrutiny, not just internal audit. If your posted range doesn't match the midpoint data driving your actual compa ratios, that inconsistency becomes a liability, not just a documentation gap.
Documentation matters as much as the calculation itself. When a compa ratio shows a gap, HR needs a defensible, job-related explanation, tenure, performance history, or market conditions, not a shrug. Pair every compa ratio audit with demographic-based analysis rather than relying on the ratio alone to prove fairness, since compa ratio measures position in a range, not the fairness of the range itself. Keep a written record of your midpoint source and methodology; that paper trail is what turns a routine audit into a non-event.
Get Reliable Midpoint Data for Your Compa Ratio Analysis
Building a compa ratio you can defend starts with a midpoint you can defend. Salary Atlas publishes BLS and OEWS-sourced wage data by job title, state, and experience level, free of paywalls or signups, with every figure linked back to its original government source. That makes it a practical starting point when your internal bands need a market check or when you're building a midpoint for a role you've never priced before.
For location-specific adjustments, the state-by-state salary breakdowns help account for geographic pay differences that a single national midpoint will miss. And if you want to see how the underlying figures get built and refreshed, the Salary Atlas methodology page documents the sourcing in enough detail to cite directly in a compensation audit.
Why Compa Ratio Deserves More Respect Than It Gets
Compa ratio gets dismissed by some compensation professionals as too blunt a tool, and that criticism misses the point. The formula was never meant to answer the fairness question by itself. It's meant to flag where to look, and most of the pushback against it actually targets bad midpoint data, not the math itself.
Conventional guidance tends to underweight how much industry and role volatility should shift that band.
If you take one thing from this, prioritize midpoint quality before you worry about the threshold you're measuring against. A defensible number built on current, sourced market data beats a precise-looking calculation built on a three-year-old internal band every time. Get the input right, and the interpretation gets a lot easier.
, Joelen Zyoktova
Sources
- Compa-ratio: Definition and how-to guide
- Compa-Ratios: What They Are and How To Use Them
- Compa-ratio - The Benchmark For Employee Salaries
FAQ
How Do You Calculate Compa Ratio?
Divide the employee's annual base salary by the role's salary midpoint, then multiply by 100 to express it as a percentage; hourly pay should be annualized by multiplying by 2,080 first.
What Is Meant by Compa Ratio?
Compa ratio is a percentage that shows where an employee's actual pay sits relative to the midpoint of their salary range, used to judge whether pay is below, at, or above target.
Recommended
Occupation wage figures on Salary Atlas come from the U.S. Bureau of Labor Statistics. Figures in this article that are not linked to a source are estimates. See our methodology.