Find U.S. BLS Salary Data by Job and State: Mean, Median, Percentiles
Find U.S. BLS salary data by job, SOC code, state, or metro. See mean, median, percentiles and use Salary Atlas for fast, free OEWS lookups.
By the Salary Atlas editorial team · Published

The Bureau of Labor Statistics publishes the country's most reliable occupational wage figures through its Occupational Employment and Wage Statistics program, covering nearly every job title at the national, state, and metro level. OEWS tables report mean and median wages plus wage percentiles, in both hourly and annual terms, updated once a year. If you need to know what a job actually pays in a specific place, this is the dataset to trust before any private survey or job board estimate.
TL;DR:
- Median wages are more reliable than averages for understanding typical pay, especially in occupations with high earners skewing the data.
- Wage percentiles reveal the pay spread within an occupation, helping negotiate offers based on a range from the 10th to the 90th percentile.
- Local wage estimates for states and metros depend on sample size, and suppressed data should be supplemented with broader or nearby figures.
- Comparing pay across regions requires matching the same wage measure (median or mean) to avoid misleading salary gaps.
- Salary Atlas provides user-friendly, regularly refreshed BLS data for quick cross-region salary comparisons without the need to analyze raw spreadsheets.
Table of Contents
- What Wage Measures Does BLS Salary Data Include?
- Where Do State and Metro Wage Estimates Come From?
- How Do You Read an OEWS Table?
- How Do You Actually Use BLS Salary Data?
- How Salary Atlas Turns BLS Tables Into Usable Answers
- What Official Wage Data Can and Can't Tell You
- Search BLS Salary Data by State and Job Title on Salary Atlas
- Sources
- FAQ
What Wage Measures Does BLS Salary Data Include?
BLS reports wages at the national level using two central measures: the mean (a simple average across all workers in an occupation) and the median (the exact middle point, where half of workers earn more and half earn less). Median tends to be the more useful figure for most people because a handful of extremely high earners can pull a mean upward without reflecting typical pay.
Beyond those two, OEWS publishes wage percentiles, usually the 10th, 25th, 75th, and 90th. These show the spread of pay within an occupation rather than a single average, which matters if you're negotiating a salary and want to know where an offer falls relative to peers.
Every figure comes in both hourly and annual form. BLS converts hourly rates to annual pay by multiplying by the assumed annual hours worked for a full-time schedule, so an hourly wage of $28.50 becomes an annual figure reflecting full-time, year-round employment. That conversion assumes full-time, year-round work, which won't match every job.
- Mean wage: total wages divided by total employment in the occupation
- Median wage: the exact midpoint of the wage distribution
- Percentiles: show the range, not just the center
- Hourly and annual figures: both published, converted using a 2,080-hour work year
Where Do State and Metro Wage Estimates Come From?
BLS wage data are available by occupation for the nation, regions, states, and many metropolitan and nonmetropolitan areas, but "many" is the operative word. Coverage depends entirely on how many workers in that occupation the survey sampled in that area.
You reach state and metro tables through the OEWS interactive maps or the state-specific data pages linked from the main OEWS site. Metro estimates cover metropolitan statistical areas like Dallas-Fort Worth or Seattle-Tacoma-Bellevue, while nonmetropolitan estimates group together rural counties that don't meet the population threshold for their own metro designation.
Some occupation and area combinations get suppressed entirely. If too few employers reported data for, say, marine biologists in a small nonmetro region, BLS won't publish a figure rather than report an unreliable one. Local-area estimates can be suppressed when sample sizes are too small, so always check the footnotes before assuming a blank cell means zero employment.
- State tables: broadest local geography, rarely suppressed
- Metro tables: cover defined metropolitan statistical areas
- Nonmetro tables: aggregate rural counties outside metro boundaries
- Suppressed cells: check footnotes for sample-size notes before drawing conclusions
How Do You Read an OEWS Table?
OEWS tables organize everything by occupation title and Standard Occupational Classification (SOC) code, a six-digit number that identifies each job precisely. The SOC system matters because job titles vary wildly between employers. "Data analyst" at one company might be classified under a completely different SOC code than the same title elsewhere, so searching by code avoids confusion.
Each row in an OEWS table typically shows employment count, mean hourly wage, mean annual wage, median wage, and the wage percentiles. Table 1 of the national OEWS release lays this out clearly for every occupation tracked nationally.
To read a row: find your SOC code, note the employment column for context on how common the job is, then compare the median against the percentiles to see where typical pay lands.
- Locate the occupation using its SOC code, not just the title
- Check the employment column to gauge how many workers the estimate covers
- Read median and mean together, since a wide gap signals high earners skewing the average
- Note the percentile columns for negotiation context
- SOC codes: precise occupation identifiers, six digits
- Download formats: CSV and Excel, both filterable by state or occupation
- Reference year: change the year to track trends over time
How Do You Actually Use BLS Salary Data?
Running a real lookup takes a handful of steps, whether you're prepping for a salary negotiation or building an HR compensation benchmark.
- Search for your occupation by title or SOC code on the OEWS tables page
- Select your geographic area: national, state, or metro
- Read the row for mean, median, and percentile figures
- Download the CSV or Excel file if you need to compare multiple occupations or areas at once
- Convert hourly to annual (or vice versa) using the 2,080-hour standard when the two figures aren't both listed
Downloading OEWS CSV or Excel files is the fastest route if you're building a multi-state or multi-occupation comparison rather than checking one job in one place.
Pro Tip: When comparing pay across two states, always compare the same wage measure. Mixing a median from one state with a mean from another will make the gap look bigger or smaller than it really is.How Salary Atlas Turns BLS Tables Into Usable Answers
Raw OEWS spreadsheets are accurate but not exactly friendly. Salary Atlas takes those same BLS figures, links every number back to its original BLS table, and refreshes the entire dataset annually, following the sourcing approach detailed on its methodology page.
The value shows up in interpretation. Salary Atlas's state-by-state breakdown of software engineer pay illustrates how the same job title can carry a meaningfully different median depending on state, which matters more in a negotiation than the national average alone.
- Every figure traces back to its BLS source table
- Data refreshed annually, not left stale for years
- State comparisons built directly from OEWS estimates
- No paywall or signup required to view the numbers
What Official Wage Data Can and Can't Tell You
Official wage data settles arguments that would otherwise run on guesswork. I've found the most common misuse isn't citing bad numbers. It's citing good numbers from the wrong reference year, or applying a national median to a local negotiation where cost of living tells a different story. Check the reference month, check the sample size note, and match your geography before you trust a figure in a real conversation.
, Joelen Zyoktova
Search BLS Salary Data by State and Job Title on Salary Atlas
Digging through OEWS spreadsheets works, but it's slow if you just want to know what a job pays in your state right now. The site provides a faster front door to the same BLS figures, republishing OEWS data with a direct link back to the original table for every number displayed.
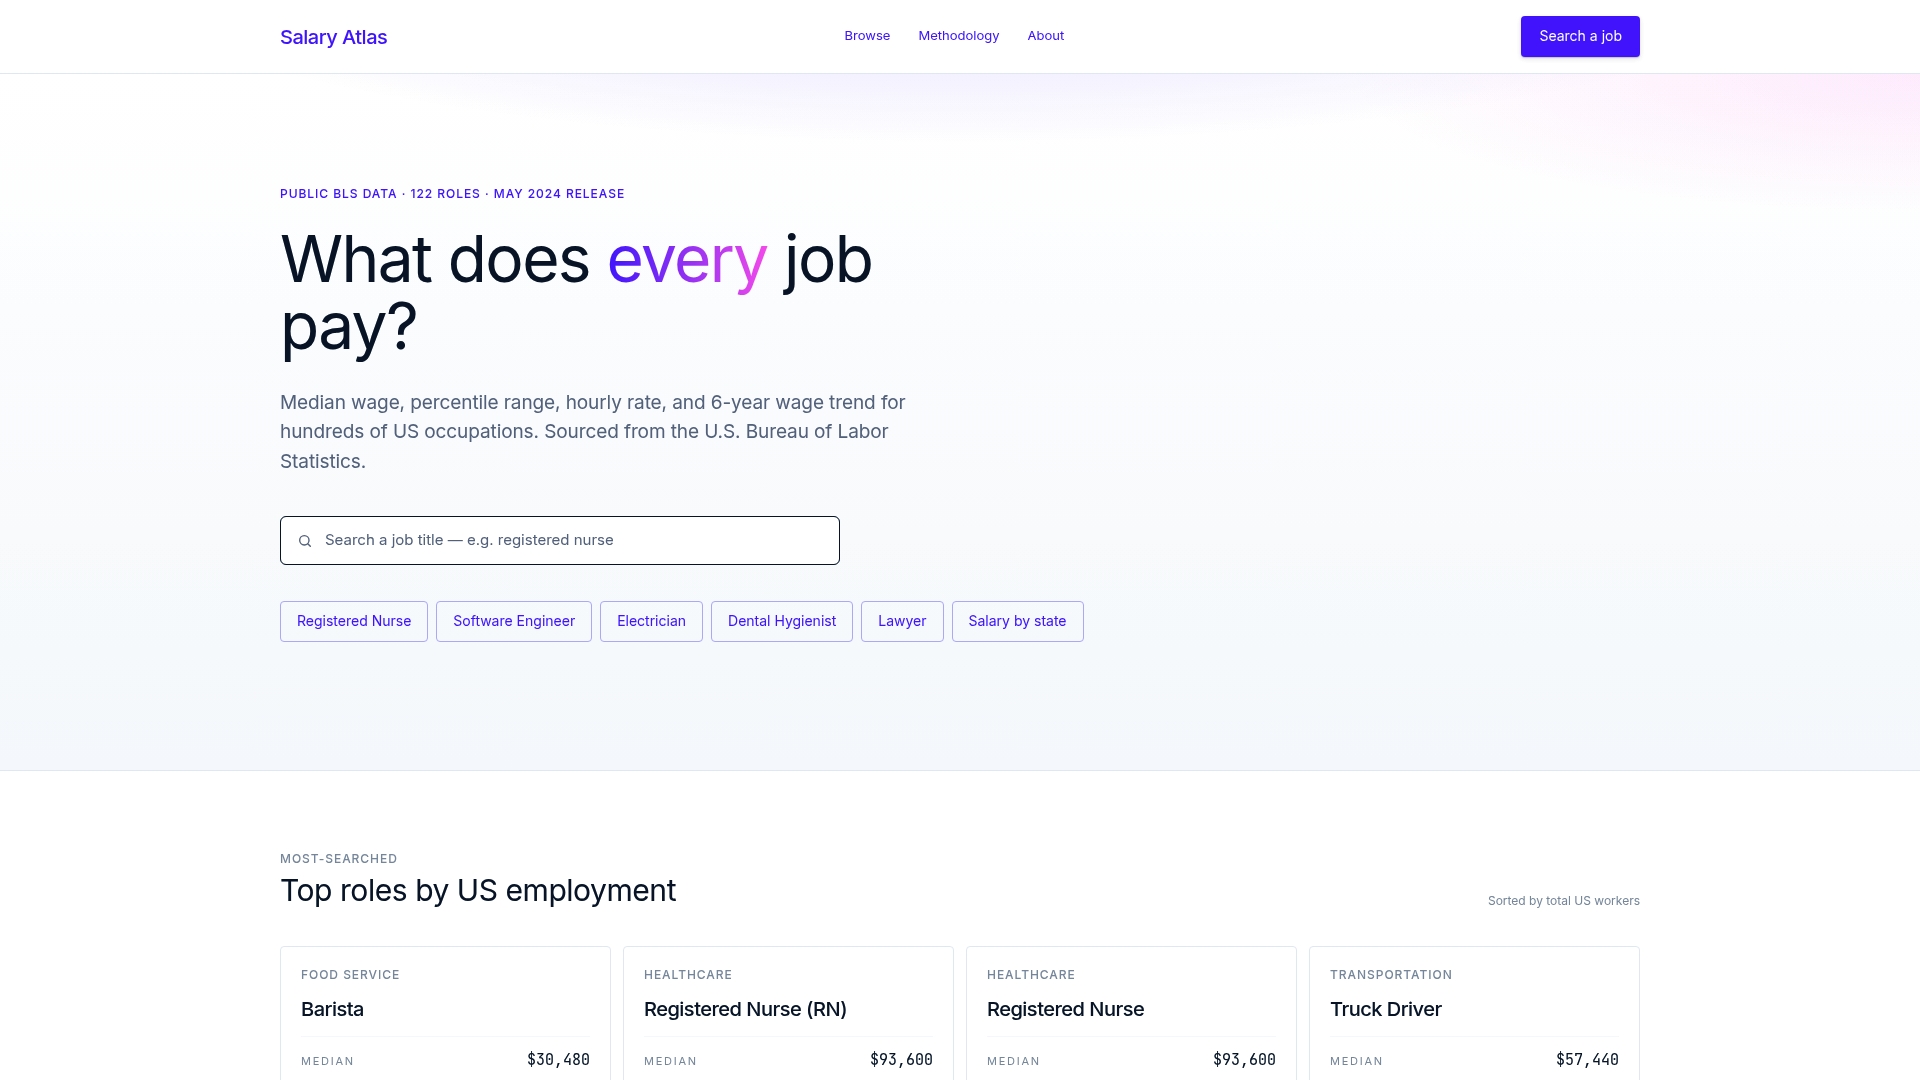
Users can search by job title and state to view the median, percentile range, and pay comparisons to nearby areas. State summary pages, trend charts showing pay changes over recent releases, and a methodology page are also available without a signup requirement. If you're weighing a job offer or benchmarking pay for your team, start with the salary by state lookup and compare your occupation across the country in a few clicks.
FAQ
Is BLS Salary Data Available for All States?
Yes, but coverage within a state depends on the occupation. Every state has OEWS tables, though specific occupation and metro combinations can be suppressed when the sample size is too small to report reliably.
What Salary Data Does the BLS Provide?
BLS provides mean and median wages, wage percentiles, and both hourly and annual figures by occupation, broken out by nation, state, metro area, and nonmetro area through the OEWS program.
What Is a Top 10% Salary in the USA?
The exact figure varies by occupation and location, so check the specific OEWS table rather than assuming one national number applies everywhere.
Is BLS Data Available to the Public?
Yes. All OEWS and OES data are free to access and download in CSV or Excel format directly from the BLS website, with no paywall or subscription required. Salary Atlas republishes the same figures in a searchable format for readers who want a quicker lookup.
Recommended
Occupation wage figures on Salary Atlas come from the U.S. Bureau of Labor Statistics. Figures in this article that are not linked to a source are estimates. See our methodology.