The Racial Wage Gap: What Researchers Need to Know
Explore the complexities of the racial wage gap, including its measurement, drivers, and implications for researchers and policymakers.
By the Salary Atlas editorial team · Published

Black workers earned about 78.0% of white workers' wages in April 2026, and Hispanic workers earned roughly three-quarters, according to CPS-based calculations from the New York Fed. Those numbers are striking on their own. They become more complicated when you realize they shift depending on whether you measure hourly or annual pay, median or mean, full-time workers only or all workers, and whether you control for education, occupation, and geography.
This guide covers all of it:
- How the racial wage gap is defined and measured (raw vs. regression-adjusted, median vs. mean)
- A national snapshot of median earnings by race and ethnicity, including gender intersections
- The primary drivers researchers have identified, from occupational sorting to discrimination
- How methodology choices change reported gaps, and what limitations to watch for
- Trends from 1980 through 2024 and where gaps have widened rather than narrowed
- Consequences for household wealth, poverty, and the broader economy
- Evidence-based policies and what the research actually shows about their effectiveness
- How to pull the raw data yourself using CPS, ACS, BLS, and Salary Atlas
By the numbers: During the 2020–2024 period, Asian households had a median income of $116,503 while Black households had a median of $55,157, a gap of more than $61,000 against a U.S. median of $80,734.
Key Takeaways
The racial wage gap in the United States is large, persistent, and only partially explained by observable differences in education and occupation, a substantial unexplained residual remains even after controlling for credentials.
| Point | Details |
|---|---|
| Current gap size | Black workers earn about 78.0% and Hispanic workers about 76.4% of white workers' wages (New York Fed, April 2026). |
| Household income disparity | Black households had a median income of $55,157 vs. a U.S. median of $80,734 during 2020–2024 (Census Bureau). |
| Main drivers | Occupational sorting and education explain a large share; an unexplained residual of about 14.9% remained in 2019 after controlling for education, experience, and region (EPI). |
| Trend warning | Gaps narrowed at lower percentiles but widened at the 80th percentile for many groups over forty years (Cleveland Fed). |
| Salary Atlas | Salary Atlas provides free, BLS-sourced occupational wage tables with percentile breakdowns and direct links to original data for occupation-level research. |
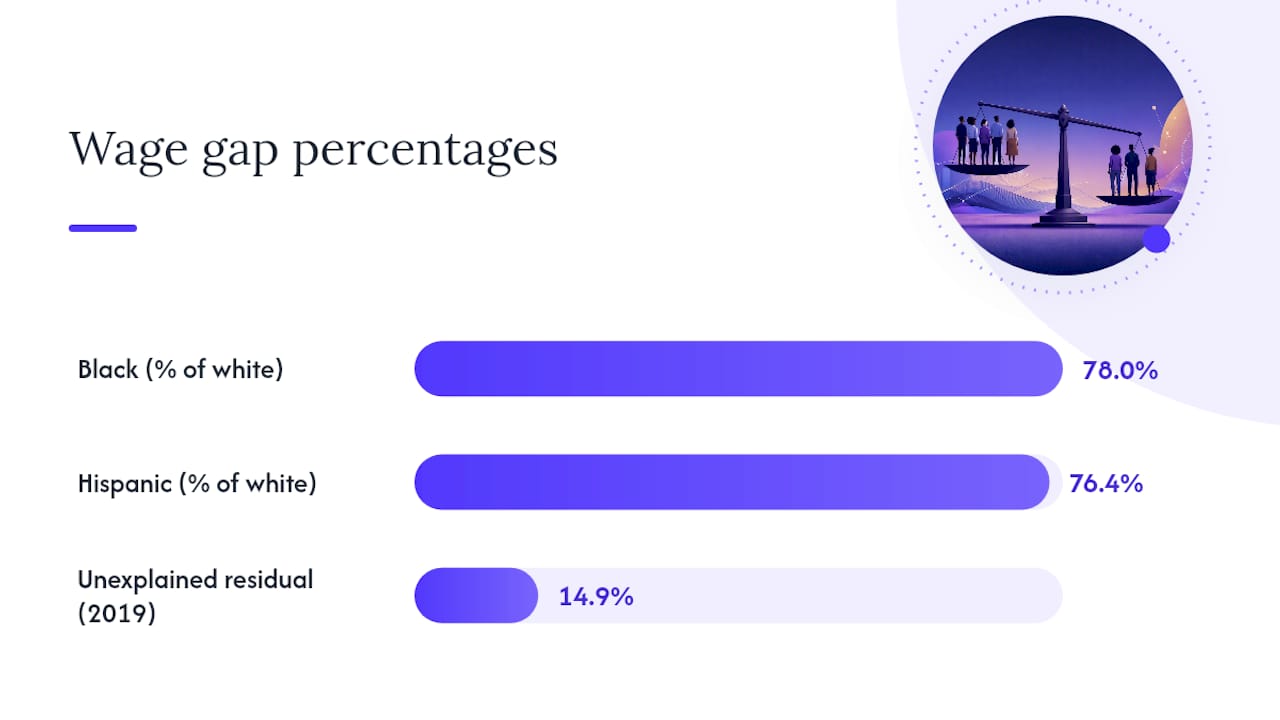
Table of Contents
- What does "racial wage gap" actually mean?
- How large is the racial wage gap right now?
- What drives the racial wage gap?
- How do researchers measure gaps, and what are the limits?
- Has the racial wage gap narrowed or widened over time?
- Why the racial wage gap matters beyond individual paychecks
- What policies actually reduce racial wage disparities?
- How to pull and use the primary data yourself
- How Salary Atlas fits into your research workflow
- What the data actually tells us, and what it doesn't
- Salary Atlas gives you the wage data behind the research
- Sources
- FAQ
What does "racial wage gap" actually mean?
The phrase gets used loosely, and that looseness causes real confusion. Researchers distinguish between at least two fundamentally different things.
The raw gap (also called the unadjusted gap) is simply the difference in median or mean earnings between two groups, with no controls applied. It captures the full observed disparity a worker experiences in the labor market.
The regression-adjusted gap applies statistical controls for factors like education, years of experience, geographic region, and occupation. What remains after those controls is often called the "unexplained" component, the portion not accounted for by observable credentials. It is consistent with discrimination, differential bargaining power, or unobserved workplace dynamics, though it cannot prove any single cause.
Neither measure is "more correct." They answer different questions.
| Term | Brief definition | When researchers use it |
|---|---|---|
| Raw (unadjusted) gap | Earnings difference with no controls | Measuring real-world disparity workers face |
| Regression-adjusted gap | Gap after controlling for education, experience, occupation, region | Isolating unexplained residual after observable factors |
| Median earnings ratio | Group A median ÷ Group B median | Comparing typical workers; less sensitive to top earners |
| Mean earnings ratio | Group A mean ÷ Group B mean | Captures full distribution, including high earners |
Key measurement trade-offs researchers weigh:
- Hourly vs. annual pay: Annual figures conflate wages with hours worked, which can overstate gaps if one group works fewer hours involuntarily.
- Full-time vs. all workers: Restricting to full-time workers removes part-time disparities but also removes a real dimension of labor-market inequality.
- Household vs. individual earnings: Household income reflects family structure (number of earners, household size) in addition to wages.
- Sample size: State-level breakdowns for smaller racial groups require pooling multiple survey years to get reliable estimates.
- Top-coding: CPS and ACS cap reported earnings at certain thresholds, which compresses apparent gaps at the top of the distribution.
How large is the racial wage gap right now?
The most recent national-level data show persistent gaps across every major racial and ethnic group relative to white workers, with meaningful variation by gender.
The New York Fed's Economic Heterogeneity Indicators (CPS-based, April 2026 snapshot) show Black workers at 78.0 cents and Hispanic workers at 76.4 cents for every dollar earned by white workers.
At the household level, the Census Bureau's 2020–2024 data tell a similar story:
| Race/Ethnicity | Median Household Income (2020–2024) |
|---|---|
| Asian | $116,503 |
| White (non-Hispanic) | Included in the U.S. median context |
| U.S. overall median | $80,734 |
| Hispanic/Latino | Below the U.S. median |
| Black | $55,157 |
The gap in concrete terms: Asian households earned a median of $116,503 versus $55,157 for Black households during the 2020–2024 period, a difference of more than $61,000 per year.
A few important caveats about this table. First, these are national-level snapshots; state-level gaps vary considerably, with some states showing much wider disparities. Second, the Asian aggregate conceals enormous internal variation, Hmong and Cambodian households, for example, have median incomes far below the Asian average. Third, intersecting with gender consistently widens gaps: Black women and Hispanic women face compounded disparities relative to white men that exceed what either the racial or gender gap alone would suggest.
The DOL's Office of Federal Contract Compliance Programs publishes per-dollar earnings ratios by race and ethnicity at the state and national level, making it a useful cross-check against CPS/ACS figures.
What drives the racial wage gap?
Compositional differences, primarily education levels and occupational distribution, explain a large share of observed gaps in most decompositions. But a persistent unexplained residual remains even after those controls, and that residual is not small.
 Cleveland Fed research finds that occupational sorting in particular drives large portions of the gap, especially at higher percentiles. Workers of color are underrepresented in the highest-paying occupations and overrepresented in lower-wage ones, and that sorting is not fully explained by education differences alone.
The Economic Policy Institute's decomposition analysis found that after controlling for education, experience, and region, an unexplained gap of about 14.9% remained between Black and white workers in 2019. That is not a rounding error. It is consistent with discrimination, differential bargaining power, or both.
NBER working paper w23733, analyzing 2000–2014 data, found that excluding Asians, most racial groups earned between roughly 50% and 80% of white incomes across the distribution, even when controlling for class and skill proxies.The main drivers, ranked roughly by how often they appear as dominant factors in decomposition studies:
- Occupational sorting: Concentration in lower-wage industries and roles accounts for a large share of the gap, particularly at the 80th percentile and above.
- Educational differences: Gaps in degree attainment and field of study contribute, though they have narrowed substantially since the 1980s.
- Pre-market conditions: Lifecycle research shows that test scores at ages 17–22 and early schooling quality predict a significant portion of earnings divergence over a career, meaning gaps that look like labor-market outcomes partly originate before workers enter the market.
- Experience and tenure: Differential on-the-job human-capital accumulation widens gaps over a career, even among workers who start at similar wages.
- Discrimination and unexplained residuals: The 14.9% unexplained gap from EPI's 2019 analysis is the clearest quantitative signal that observable credentials do not account for everything.
- Bargaining power: EPI's framework emphasizes that structural shifts in labor-market power, declining unionization, weakened enforcement, disproportionately affect workers of color.
- Geography: Workers of color are more concentrated in lower-wage regions and metropolitan areas, which contributes to raw gaps but does not fully explain adjusted ones.
How do researchers measure gaps, and what are the limits?
The most common analytical tool is the Oaxaca-Blinder decomposition, which splits the observed wage gap into two parts: the portion explained by differences in worker characteristics (education, experience, occupation) and the unexplained portion attributed to differences in how those characteristics are rewarded. It is powerful but sensitive to which controls you include.
Other approaches include:
- Regression controls: Running a wage regression with race as a variable and controlling for observable factors; the coefficient on race is the adjusted gap.
- Distributional analyses: Examining gaps at the 10th, 50th, and 90th percentiles separately, since a single mean or median can mask very different patterns across the distribution.
- Sample selection corrections: Accounting for the fact that labor force participation rates differ by race, which means observed wages reflect a selected sample.
- Top-coding: CPS and ACS cap earnings at certain thresholds, compressing apparent gaps among high earners.
- Occupational classification changes: BLS reclassifies occupations over time, making long-run trend comparisons tricky.
- Unobserved ability: Controls for education do not fully capture school quality, which varies systematically by race and geography.
- Geographic cost-of-living: Nominal wage comparisons do not adjust for purchasing power, which matters when groups are geographically concentrated in different cost environments.
- Small samples: State-level breakdowns for American Indian/Alaska Native or multiracial populations often have too few observations for reliable single-year estimates; researchers pool multiple years from the ACS to address this.
A practical example: A study controlling only for education and experience might report an adjusted gap of 10%. Add occupation as a control, and the gap shrinks to 7%, but this raises a question: if occupational sorting itself reflects discrimination or structural barriers, controlling for it may understate the true effect of race on earnings. Which controls are appropriate depends on the research question.
The Census Bureau's own methodological notes flag that small sample sizes for some racial groups in state-level breakdowns require caution and pooling across years, a point worth keeping in mind when comparing state-level figures.
Has the racial wage gap narrowed or widened over time?
The broad answer: it narrowed significantly from the 1960s through the early 1980s, then progress largely stalled, and in some parts of the distribution it reversed.
Cleveland Fed analysis covering roughly forty years of U.S. data finds that compositional factors, particularly rising education levels among Black and Hispanic workers, drove much of the narrowing at lower percentiles. But the same research identifies a troubling pattern: gaps at the 80th percentile widened for many groups, meaning high-earning workers of color fell further behind their white counterparts even as lower-wage gaps partially closed.
Key trend findings:
- Gaps at the bottom of the distribution narrowed more than gaps at the top, partly because minimum wage floors compress lower-end dispersion.
- The 80th-percentile gap widened for many groups over the forty-year window, driven largely by occupational sorting into high-wage roles.
- Cohort effects matter: younger cohorts of Black workers entered the labor market with smaller education gaps than their predecessors, but wage gaps did not close proportionally.
- Lifecycle research shows gaps often widen over a career, not just at entry, because on-the-job human-capital accumulation is unequal.
- The 2019–2024 window saw some compression at the median, partly driven by tight labor markets and minimum wage increases in many states, but the upper-percentile divergence persisted.
What to look for in trend charts: A single time-series of median earnings ratios misses the distributional story. Charts that show the gap at the 50th and 80th percentile simultaneously reveal that the "narrowing" narrative is much more accurate at the bottom than at the top.
The National Bureau of Economic Research and CPS/ACS longitudinal files are the primary sources for cohort-level trend analysis. For state-level trend comparisons, the ACS's five-year estimates provide the sample sizes needed for reliable breakdowns.
Why the racial wage gap matters beyond individual paychecks
A persistent pay gap does not stay contained to a single paycheck. It compounds.
Lower wages mean lower retirement contributions, less home equity, and smaller emergency savings. Over a 40-year career, a worker earning 78 cents on the dollar accumulates dramatically less wealth than a worker earning the full dollar, even if both save at the same rate. The Census Bureau's household income data show that Black households had a median income of $55,157 during the 2020–2024 period, compared to a national median of $80,734, a gap that translates directly into lower homeownership rates, higher rates of housing cost burden, and reduced capacity to absorb economic shocks.
The consequences extend beyond individual households:
- Wealth accumulation: Earnings shortfalls reduce contributions to 401(k)s, home equity, and other wealth-building assets, compounding intergenerational inequality.
- Poverty rates: Lower median incomes push more households below the poverty line, with particular concentration among Black and Hispanic families with children.
- Homeownership: The racial homeownership gap tracks closely with the income gap; lower earnings reduce mortgage eligibility and down-payment capacity.
- Retirement security: Workers in lower-wage jobs are less likely to have employer-sponsored retirement plans and less able to contribute when they do.
- Aggregate demand: Communities with lower median incomes spend less locally, reducing tax bases and constraining public investment in schools and infrastructure.
What policies actually reduce racial wage disparities?
No single policy closes the gap. The research points to a portfolio of interventions, each effective in specific contexts.
Policies with empirical support:
- Minimum wage increases: Wage floors compress the lower end of the distribution where workers of color are overrepresented. The evidence consistently shows minimum wage increases reduce Black-white and Hispanic-white gaps at the bottom of the distribution, though effects at the median are smaller.
- Unionization and collective bargaining: EPI's framework identifies declining union density as a structural driver of widening gaps. Unionized workers of color earn more relative to their non-union counterparts than white unionized workers do, meaning unions have an equalizing effect.
- Pay transparency laws: State-level pay transparency requirements (requiring employers to post salary ranges) reduce information asymmetries that disadvantage workers with less negotiating leverage. Early evidence from states that have adopted these laws suggests modest but real compression of unexplained gaps.
- Registered apprenticeship programs: The Department of Labor's registered apprenticeship framework provides structured pathways into higher-wage trades. Access and completion rates for workers of color vary by program design; programs with active outreach and retention support show better equity outcomes.
- Targeted credentialing and training: Programs that address pre-market gaps (early childhood education, college access, STEM pipeline programs) have the longest lag but the largest long-run effects, given how much of the lifecycle gap originates before workers enter the labor market.
How to pull and use the primary data yourself
The best starting point depends on what you want to measure.
Use CPS (Current Population Survey) for national and regional median earnings by race and ethnicity, year-over-year trends, and labor force participation rates. The CPS Annual Social and Economic Supplement (ASEC) is the standard source for annual earnings. Use ACS (American Community Survey) for state- and county-level breakdowns and for smaller racial groups that require larger sample sizes. Use BLS/OEWS (Occupational Employment and Wage Statistics) for occupation-specific wage distributions by percentile.
A short checklist before you run any analysis:
- Pick your unit: Individual earnings or household income? They answer different questions and should not be mixed.
- Pick your measure: Median hourly wages are the cleanest for cross-group comparisons; mean annual earnings are more sensitive to top earners and hours worked.
- Check for top-coding: CPS top-codes earnings above certain thresholds; if you are studying high earners, this matters.
- Decide on controls: Know in advance whether you want the raw gap or the adjusted gap, and be explicit about what each control does to the interpretation.
- Pool years for small groups: State-level ACS estimates for American Indian/Alaska Native or multiracial populations are unreliable in single-year files; use five-year estimates or pool multiple years.
Quick how-to: To pull a simple median earnings table by race from the ACS, go to data.census.gov, select Table B20017 (Median Earnings in the Past 12 Months by Sex by Race), choose your geography (national, state, or metro area), and download the five-year estimate file. Cross-check any figure you find against the OFCCP earnings disparity tables for a second source.
Primary data sources to bookmark:
- Census Bureau ACS: data.census.gov
- BLS/OEWS: bls.gov/oes
- CPS ASEC: census.gov/programs-surveys/cps
- New York Fed EHI: newyorkfed.org (earnings ratios updated monthly)
- DOL/OFCCP: dol.gov/agencies/ofccp
How Salary Atlas fits into your research workflow
Salary Atlas publishes up-to-date, BLS-sourced median and percentile wage tables by occupation and state, with every figure linked back to its original BLS/OEWS source. No paywall, no signup, no fabricated trends.
For readers exploring racial wage gaps by occupation, Salary Atlas is a practical first stop for checking where a given role sits in the wage distribution. The principal salary page, for example, shows how occupational sorting affects pay in education leadership, with BLS-sourced percentile breakdowns that let you see the full distribution rather than just the median.
How to use Salary Atlas responsibly in this context:
- Use occupation pages to identify where a role sits in the national wage distribution (10th, 25th, 50th, 75th, 90th percentile).
- Cross-check the figures against BLS/OEWS directly using the source links on each page.
- Use the state-level salary pages to explore geographic variation, then return to ACS microdata for race-specific breakdowns within states.
- Review the Salary Atlas methodology page to understand exactly which BLS survey each figure comes from and when it was last updated.
What the data actually tells us, and what it doesn't
The research on racial wage gaps is more rigorous than most public debate acknowledges, and more unsettled than some advocates on either side admit.
The compositional story is real. Education gaps, occupational sorting, and geographic concentration explain a substantial portion of observed disparities. The Cleveland Fed's forty-year decomposition makes that clear. But "explained" does not mean "fair" or "inevitable." Occupational sorting itself reflects historical exclusion, differential access to networks and credentials, and ongoing barriers to entry in high-wage fields. Explaining a gap with occupational sorting is not the same as explaining it away.
The unexplained residual is also real. It is consistent with discrimination, differential bargaining power, and structural disadvantages that do not show up in a résumé.
What the data cannot do is assign causation with certainty. The unexplained residual is consistent with discrimination, but it is also consistent with unobserved factors that researchers cannot measure. That ambiguity is not a reason to dismiss the evidence. It is a reason to design policies that address multiple mechanisms simultaneously, rather than waiting for a single definitive study.
The distributional finding from the Cleveland Fed deserves more attention than it typically gets: gaps widened at the 80th percentile even as they narrowed at the bottom. That means the problem is not just about entry-level wages or minimum wage floors. It is about access to the highest-paying roles, career progression, and the structural barriers that keep workers of color underrepresented at the top of wage distributions.
Salary Atlas gives you the wage data behind the research
Salary Atlas publishes free, BLS-sourced wage tables for every major U.S. occupation, updated annually and linked directly to their original government sources. If you are a student, researcher, career advisor, or policy analyst working through the numbers behind racial income disparity, Salary Atlas gives you the occupational wage baselines you need without a paywall or a subscription.
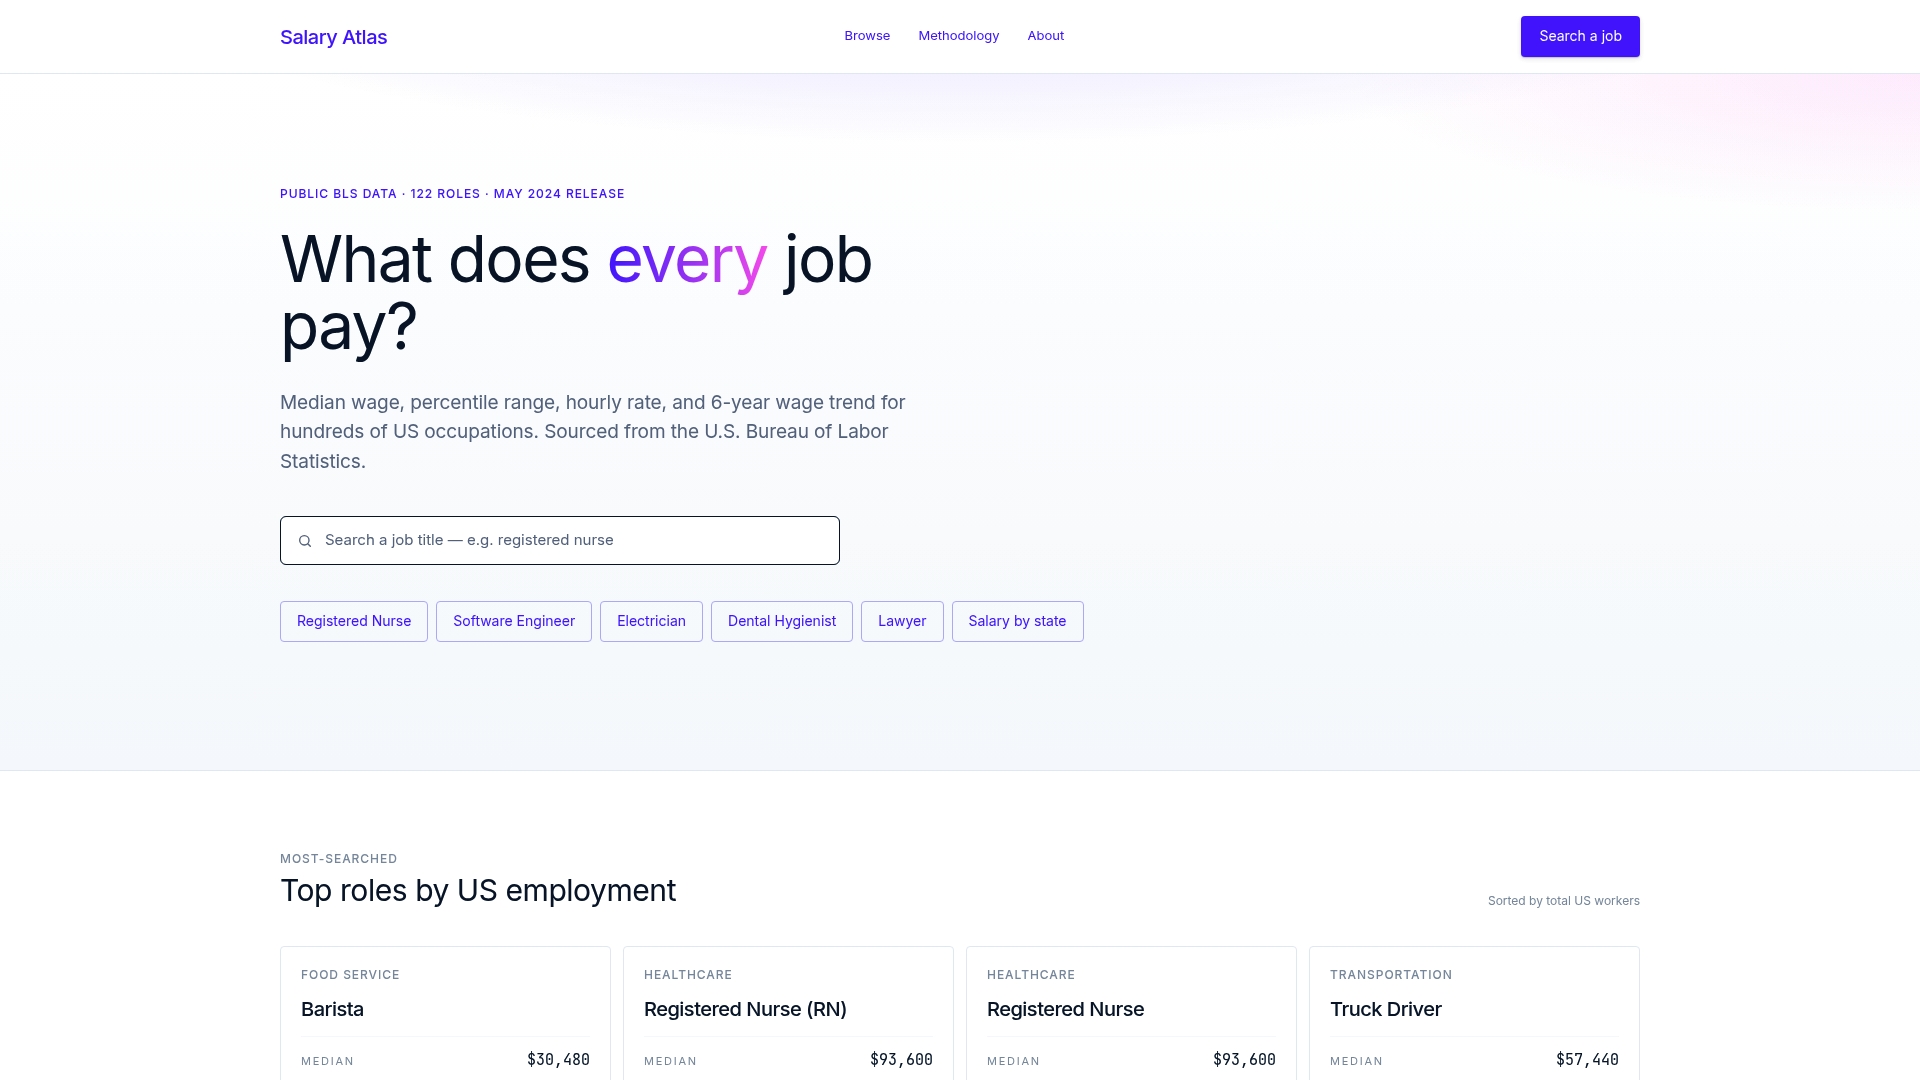
Start with the Salary Atlas homepage to search by job title or browse by state. Each occupation page shows the full percentile distribution (10th through 90th), a six-year wage trend, and a direct link to the underlying BLS/OEWS data. For geographic variation, the salary-by-state pages let you compare medians across all 50 states. Pair those figures with CPS or ACS race-specific breakdowns, and you have the foundation for a rigorous, source-linked analysis.
Sources
- How Income Varies by Race and Geography
- Changes in Wage Gaps over Forty Years in the United States
- Understanding black-white disparities in labor market outcomes requires models that account for persistent discrimination and unequal bargaining power | Economic Policy Institute
- NBER working paper w23733
- Economic Heterogeneity Indicators, national earnings (New York Fed)
FAQ
What is the racial wage gap in the U.S. right now?
At the household level, Black households had a median income of $55,157 versus a U.S. median of $80,734 during the 2020–2024 period.
What is the difference between the raw and adjusted racial wage gap?
The raw gap is the observed earnings difference with no controls applied.
Has the racial wage gap gotten smaller over time?
Progress has been uneven. Gaps narrowed at lower percentiles over the past forty years, partly due to minimum wage floors and rising education levels.
Which policies have the strongest evidence for reducing racial pay disparities?
Minimum wage increases, unionization, and pay transparency laws show the clearest evidence for compressing gaps at the lower and middle of the distribution. Registered apprenticeship programs and stronger anti-discrimination enforcement help in specific contexts, but no single policy addresses the full distribution.
Where can I find reliable racial wage data by occupation or state?
The BLS/OEWS, CPS, and ACS are the primary public datasets. Salary Atlas provides free, BLS-sourced occupational wage tables with percentile breakdowns and direct links to original government data, making it a practical starting point for occupation-level comparisons before drilling into race-specific microdata.
Recommended
Occupation wage figures on Salary Atlas come from the U.S. Bureau of Labor Statistics. Figures in this article that are not linked to a source are estimates. See our methodology.