Geographic Pay Differentials: What They Are, When to Use Them
Discover how geographic pay differentials can optimize your compensation strategy and enhance your recruitment in diverse labor markets.
By the Salary Atlas editorial team · Published

A geographic pay differential is a percentage or flat-dollar adjustment applied to a baseline pay level to reflect local labor-market differences. Two signals tell you whether your organization needs one: your hiring footprint spans labor markets with genuinely different competitive pressure, or remote work has put you in direct competition with employers in cities you never used to recruit from. If either applies, the next move isn't a policy debate. It's running a payroll impact model on your highest-headcount roles to see what adoption would actually cost.
- What it is: a percentage or flat-dollar adjustment to a baseline, not a cost-of-living stipend
- When to use it: multi-market hiring footprint, or remote work exposing you to out-of-market competition
- First step: model payroll impact on key roles before drafting policy
Key Takeaways
Geographic pay differentials work when they're built on cost-of-labor data and reviewed on a fixed annual cadence, not adjusted informally as complaints arise.
| Point | Details |
|---|---|
| Definition matters | A differential adjusts baseline pay for local labor-market cost, not local living cost. |
| Adoption is common | 73% of multi-location companies use some form of differential, more often in larger firms. |
| Pick a model deliberately | Premium/discount, separate structures, and tiered zones each trade precision against admin load. |
| Anchor remote pay clearly | Most full-time remote workers get anchored to residence; document the fallback rule in advance. |
| Salary Atlas backs the math | BLS-sourced medians and state-level data give HR teams a traceable anchor for their calculations. |
Table of Contents
- Definition and Why Employers Use Geographic Pay Differentials
- Common Policy Models: Premiums, Separate Structures, and Zones
- What Data Should You Use to Set Geographic Pay Differentials?
- How Do You Calculate a Geographic Pay Differential?
- Policy Design: Locations, Eligibility, and What Pay Components Vary
- Governance, Review Cadence, and Talking to Employees
- A Quick Numeric Example
- How Salary Atlas Supports Defensible Geo-Pay Decisions
- A Practitioner's Take on Getting the Balance Right
- Get Started Modeling Your Own Geographic Pay Differentials
- Sources
- FAQ
Definition and Why Employers Use Geographic Pay Differentials
Geographic pay differentials get confused with cost-of-living adjustments constantly, but they measure different things. A COLA tracks what it costs an employee to live somewhere; a geographic differential tracks what it costs an employer to hire competitive talent there. Those numbers frequently diverge, and pay strategy built on the wrong one either overpays in cheap-living, high-demand markets or underpays in expensive but low-competition ones.
Three forces usually drive adoption:
- Cost of labor, which reflects local salary competition for a role, not local prices
- Recruitment and retention pressure in markets where you're losing candidates or staff to better-paying competitors
- Internal equity, the need to keep pay differences explainable across a workforce that increasingly compares notes online
Common Policy Models: Premiums, Separate Structures, and Zones
Most organizations pick from three approaches, and the WorldatWork survey shows how they split in practice: Many organizations apply a percentage premium or discount to a baseline, while others build entirely separate base pay structures by location.
- Premium/discount to baseline, simplest to administer, easiest to explain, but loses precision in extreme high or low-cost markets.
- Separate pay structures, a distinct range for each location, more accurate but heavier to maintain across dozens of markets.
- Tiered zones, locations grouped into a handful of bands (Tier 1 major metro, Tier 2 secondary city, and so on), balancing precision against administrative load.
What Data Should You Use to Set Geographic Pay Differentials?
Cost-of-labor benchmarks from salary surveys and BLS Occupational Employment and Wage Statistics data should anchor your differentials. Cost-of-living indices are useful context, not a primary input, because they measure consumer prices rather than what competitors actually pay for the role.
City and metro-area indicators dominate current practice. According to the WorldatWork survey, Over half of organizations base differentials on city or metro indicators, followed by worksite or reporting location, then zip code or state, then broader zone groupings.
- Refresh survey data annually at minimum
- Check hot job categories (software engineering, skilled trades in tight local markets) more frequently, since their pay can move faster than an annual cycle catches
How Do You Calculate a Geographic Pay Differential?
The math is straightforward once you pick an anchor. Here's the workflow:
- Choose an anchor. Most organizations use either a national composite median or their headquarters market, and pick a percentile (50th is common, though competitive roles may warrant the 65th or 75th).
- Collect location medians for each target city or zone from salary survey data or BLS/OES figures.
- Compute the differential. The standard formula: anchor × (1 + differential%) = location-adjusted midpoint. A flat-dollar adjustment works the same way, just substituting a fixed amount for the percentage.
- Model the payroll scenario across a sample population to see total incremental cost, and test sensitivity by rerunning at a different percentile.
| Anchor | Location | Differential | Adjusted midpoint |
|---|---|---|---|
| $150,000 | San Francisco | +12% | $168,000 |
| $150,000 | Cleveland | -8% | $138,000 |
Policy Design: Locations, Eligibility, and What Pay Components Vary
Assigning a location to a remote employee is where most policies get tested. In-office and hybrid staff are usually anchored to their nearest work location or their reporting location. Full-time remote workers are different: the WorldatWork data shows a majority get tied to their residence, which is exactly where friction shows up when someone relocates.
- Set a clear fallback rule (residence for remote, reporting location for hybrid) and write it down before disputes arise
- Apply the differential to base salary; handle bonuses and equity separately, since those often follow different logic tied to company-wide performance rather than local market rates
- Build an exception process for edge cases (dual-location employees, contractors converting to staff)
Governance, Review Cadence, and Talking to Employees
Annual review is standard practice, with interim checks reserved for roles where local demand is moving fast. Comp, HRIS, and finance should each have a defined role: comp sets the methodology, HRIS handles system configuration, finance signs off on budget impact.
- Explain the rationale before rolling out changes, not after
- Give concrete examples showing how the policy affects real roles, not abstract percentages
- Time announcements ahead of a pay cycle, never mid-cycle
- Equip managers with an FAQ sheet before employees start asking questions
- When presenting to leadership, lead with the payroll delta and the retention risk of doing nothing
A Quick Numeric Example
Take an anchor midpoint of $150,000. For example, a San Francisco office might use a positive differential and a Cleveland office a negative differential to adjust base salary midpoints.
| Location | Adjusted midpoint | Headcount | Total budget |
|---|---|---|---|
| San Francisco | $168,000 | 5 | $840,000 |
| Cleveland | $138,000 | 5 | $690,000 |
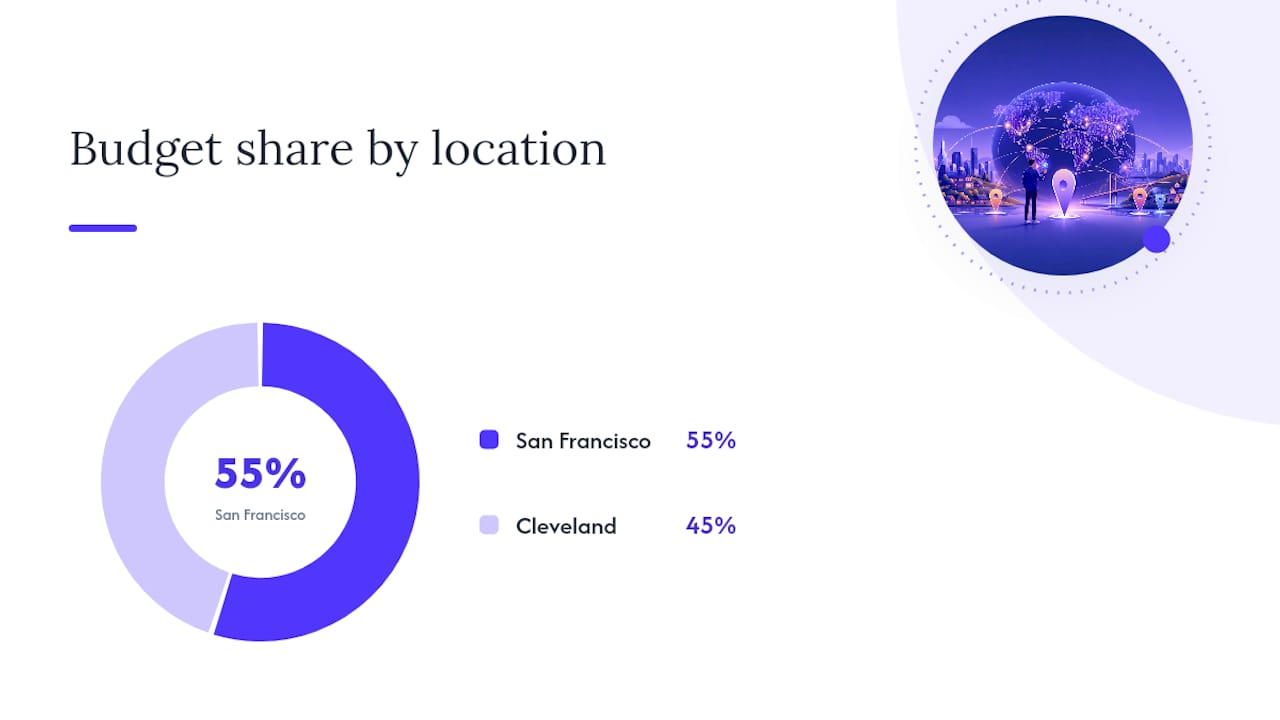
Same role, same headcount, a $150,000 gap in total budget. That's the number that gets a CFO's attention.
How Salary Atlas Supports Defensible Geo-Pay Decisions
Every figure Salary Atlas publishes traces back to BLS Occupational Employment and Wage Statistics data, not an internally modeled estimate. That matters when you need to defend an anchor or a location median to finance or legal.
- Median, range, and multi-year trend data by occupation and state map directly onto the anchor and location-median steps in your calculation workflow
- Transparent source links mean you can show exactly where a number came from, not just cite a vendor's black-box estimate
- The methodology page documents sourcing in full, and occupation pages like data analyst salary trends give a ready template for pulling comparable figures
A Practitioner's Take on Getting the Balance Right
The real tension isn't cost of labor versus cost of living. It's precision versus your team's capacity to administer it. Tiered zones and a firm 90-day grandfathering rule solve more remote-work friction than another round of city-level pricing ever will.
Get Started Modeling Your Own Geographic Pay Differentials
Building a defensible geo-pay policy starts with numbers you can trace, not estimates you have to take on faith. Salary Atlas publishes BLS-sourced medians, ranges, and multi-year trends by occupation and state, with every figure linked back to its federal source, so you can pull an anchor median and a location median from the same trustworthy dataset instead of stitching together conflicting vendor reports.
Start by pulling your anchor role's national median from Salary Atlas, then compare it against target-market state figures on the salary by state page to run your first differential calculation. If you want to see how the sourcing holds up under scrutiny before you cite it internally, the methodology page lays out exactly how the data gets pulled and refreshed.
Sources
- Location, Location, Location: The State of Geographic Pay Differentials (WorldatWork survey)
- Geographic pay differential (SalaryCube guide)
FAQ
What are examples of pay differentials?
Common examples include a percentage premium for a high-cost metro like San Francisco, a flat-dollar discount for a lower-cost city, and shift differentials for night or weekend work, which operate on the same premium-to-baseline logic but for schedule rather than location.
How much is a 10% shift differential?
A 10% shift differential adds 10% to an employee's base hourly or salary rate for working a designated shift, calculated the same way as a geographic premium: base rate × 1.10.
What are the geographic pay zones?
Geographic pay zones are tiers (often three to five) that group locations with similar labor costs, letting an employer apply one differential to an entire tier instead of pricing each city individually.

What does 15% shift differential mean?
It means an employee's base pay is multiplied by a factor reflecting the shift premium for hours worked in that shift category, following the same percentage-adjustment formula used for location-based differentials.
Should every multi-location employer adopt a geographic pay differential?
Not automatically. It makes sense once your markets show materially different labor costs; if your locations are similar in competitiveness, a single national pay range may be simpler and equally competitive.
Recommended
Occupation wage figures on Salary Atlas come from the U.S. Bureau of Labor Statistics. Figures in this article that are not linked to a source are estimates. See our methodology.